
Current Semester: Summer 2026
CS661 - Big Data Visual Analytics
For more details and list of topics that will be covered, please check the past course section at the bottom of this page.
Past Courses:
ESC 111/2 - Fundamentals of Computing (Institute Core Course) (Spring 2026, Autumn 2026)
CS661 - Big Data Visual Analytics (Spring 2023, Spring 2024, Spring 2025, Summer 2025, Summer 2026)
Click for more details
Prerequisites:
Basics of Linear Algebra, Statistics, and Probability theory will be beneficial but not mandatory, knowledge in Programming (C/C++, Python)Course Description:
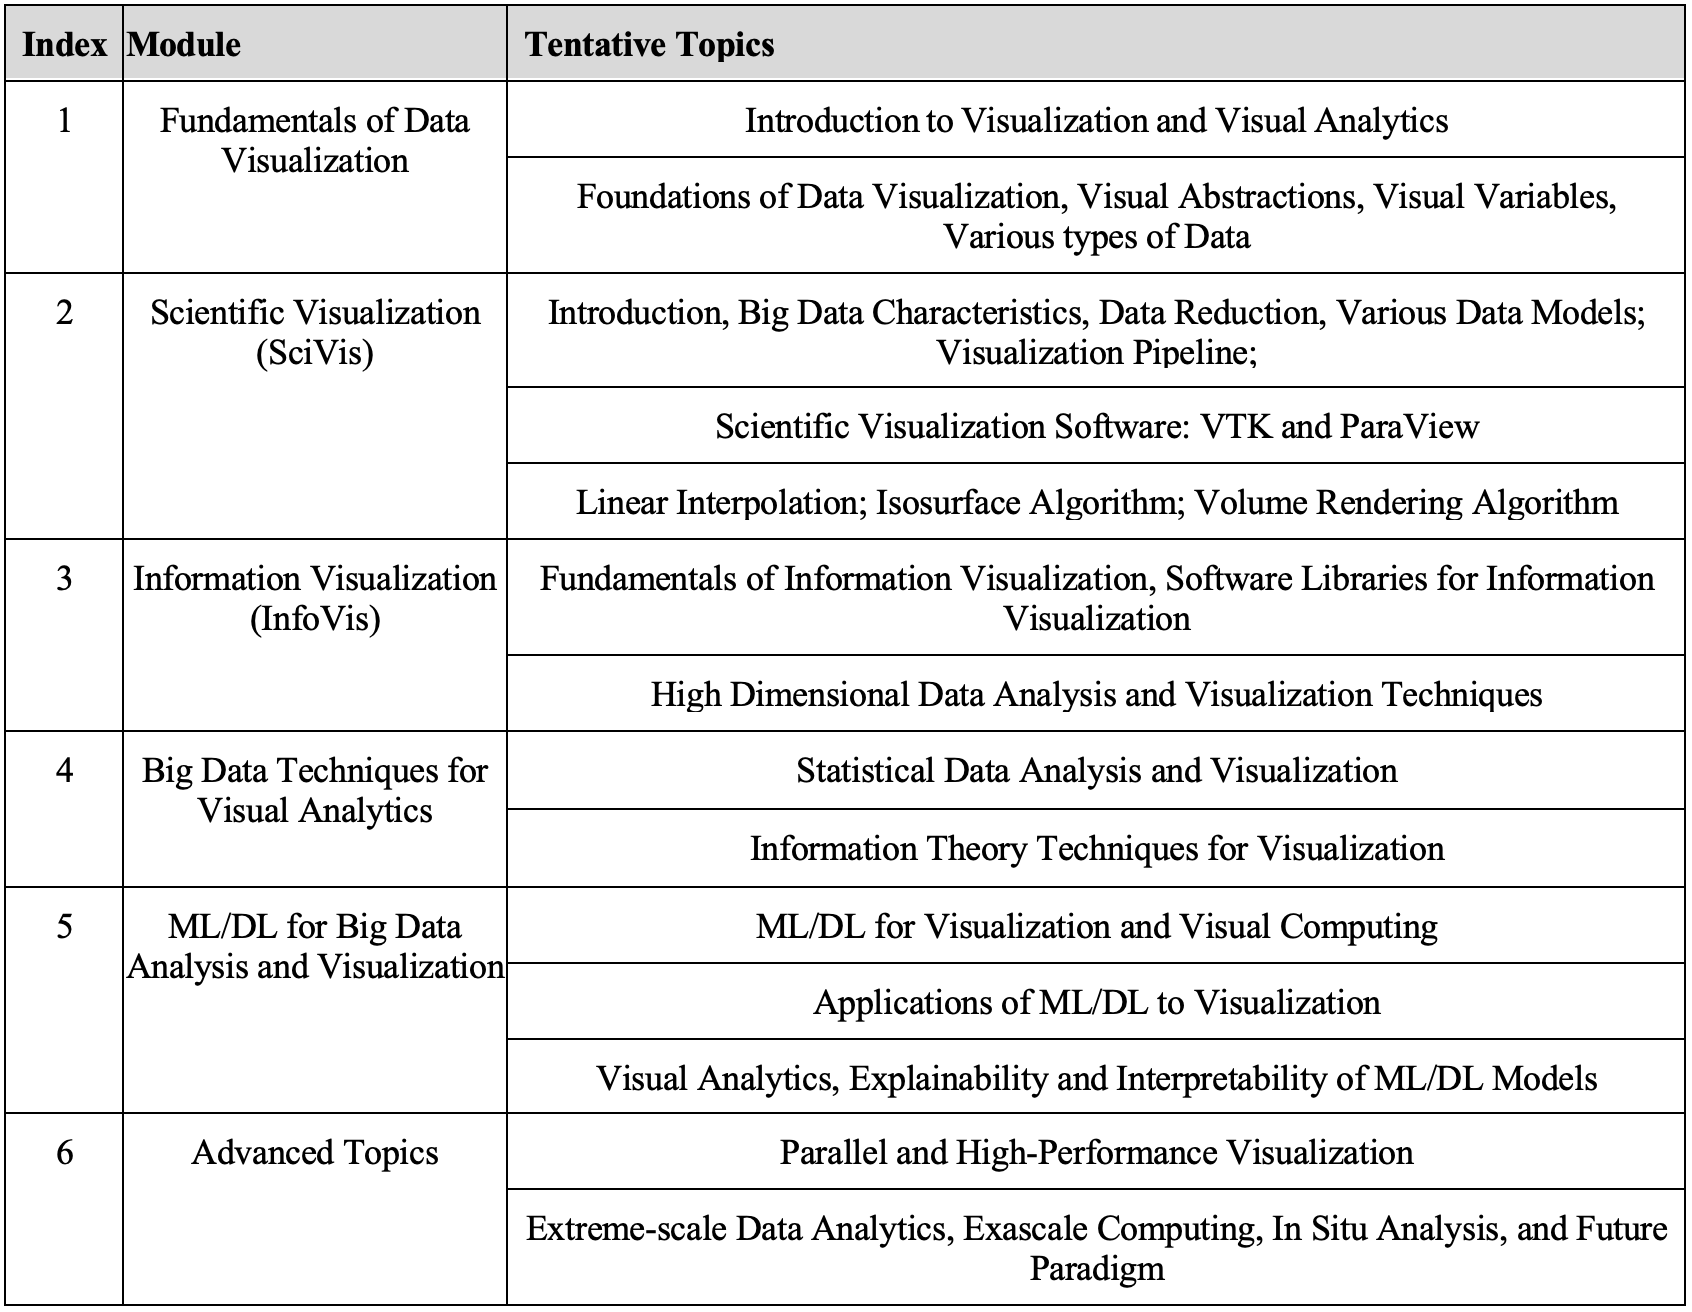
The necessity of visual analytics capabilities for big data is becoming omnipresent due to its significant demand in the current age of data science and analytics. Interactive data visualization techniques enable us to comprehend and explore diverse types of complex data sets efficiently so that patterns and features from the data can be readily identified and studied in detail. As the data grows larger and becomes intricate, it poses significant challenges to manage, curate, and explore such large data sets in a scalable manner. These data sets can come from various scientific simulations as well as from social media, IoT, various sensors, and many other industry and application domains. In this course, we will cover a comprehensive view of data visualization techniques with a specific focus on the techniques that are applicable to big data. We will discuss the theory and foundations of visualization techniques and have hands-on exercises on visualizing different types of data sets using available visualization software and libraries. We will study scientific and information visualization techniques with a focus on data compression, statistical and information theory techniques, and selected high-performance visualization algorithms. Next, we will discuss how modern machine learning and deep learning techniques are adapted for big data visual analytics. Finally, we will learn about exascale visual computing and state-of-the-art in situ analysis techniques and conclude by discussing the future paradigms of the big data visual analytics domain.The contents for this course will be based on a few books and research papers from top-tier journals and conferences such as IEEE TVCG, CGF, ACM CHI, IEEE/ACM Supercomputing, IEEE Visualization, EuroVis and EuroGraphics, IEEE Pacific Visualization, IEEE LDAV, EGPGV, etc.
(Tentative) Course Contents:
Books, References, and Resources:
1. Data Visualization: Principles and Practice by Alexandru C. Telea, CRC Press.2. Visualization Analysis and Design by Tamara Munzner, A K Peters Visualization Series, CRC Press.
3. The Visualization Handbook edited by Charles D. Hansen and Chris R. Johnson.
4. Research papers, articels, and other study materials provided during the class to cover selected topics.
CS360 - Introduction to Computer Graphics (Autumn 2023, Autumn 2024, Autumn 2025)
Click for more details
Prerequisites:
Linear Algebra, knowledge in Programming (JavaScript, HTML, CSS)Course Description:
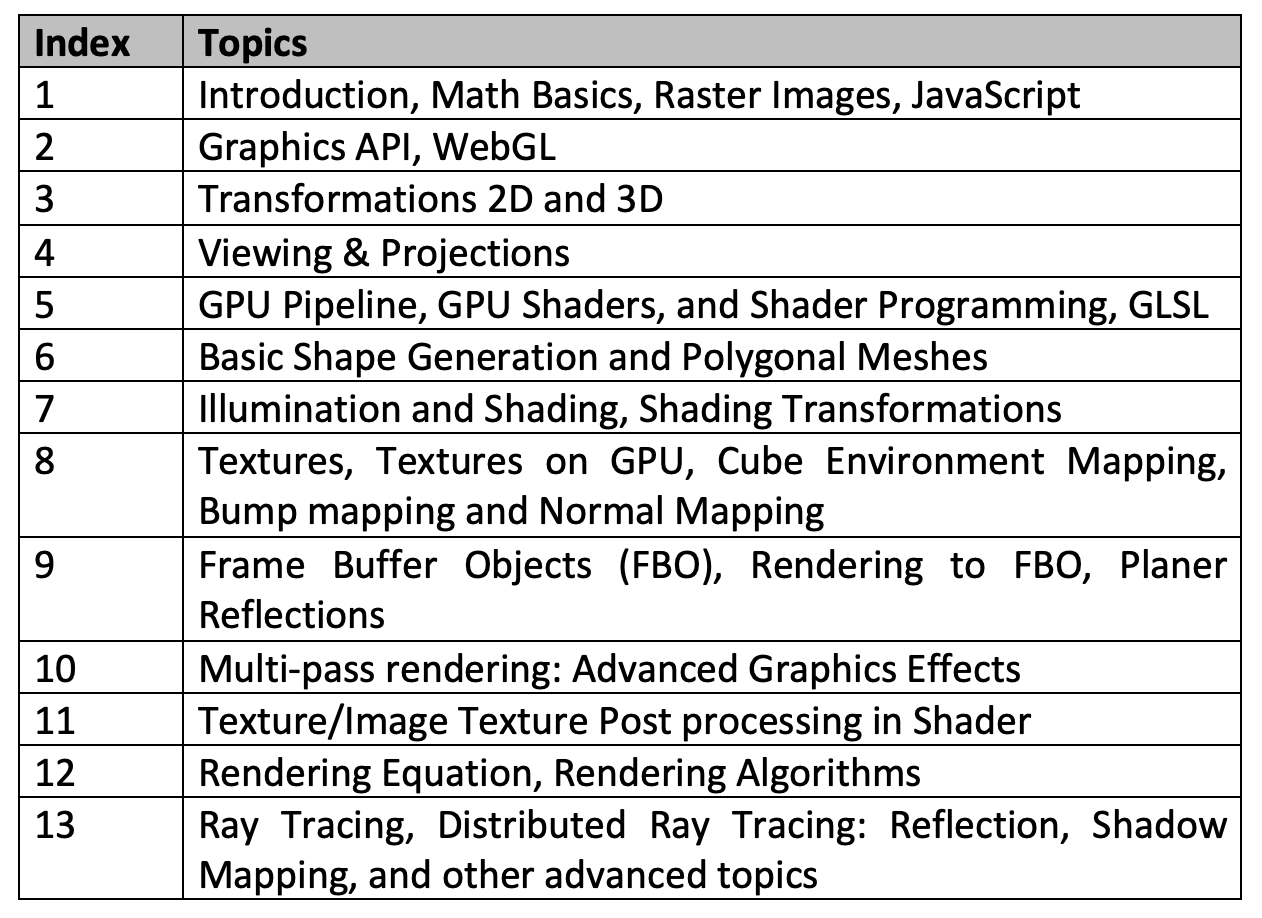
Computer graphics is one of the fundamental topics in computer science that deals with generation of images or any kind of visualization in a digital device. The goal of learning computer graphics is to develop a comprehensive understanding of the principles, techniques, and applications of computer-generated imagery in various disciplines. Through this course, the students will learn the fundamental concepts and theories of 2D and 3D graphics algorithms and through several programming assignments they will gain hands on experience on 2D/3D interactive graphics programming. Students will also learn about various rendering paradigms that are used to generate realistic and real-time images. To generate real-time graphics, we will cover GPU shader programming. We will also discuss Ray Tracing techniques that are used to produce realistic graphics by simulating the light transport phenomena. Through this course, students will gain proficiency in graphics programming, enabling them to create and manipulate visual content for a wide range of disciplines, including gaming, animations, visualization, and design.(Tentative) Course Contents:
Books, References, and Resources:
1. Fundamentals of Computer Graphics, Steve Marschner and Peter Shirley, 4th Ed, CRC Press.2. Interactive Computer Graphics, A Top-Down Approach with WebGL, Edward Angle and Dave Shreiner, 7th Ed, Pearson.
3. Realistic Ray Tracing, Peter Shirley and R. Keith Morley, AK Peters.
4. Computer Graphics: Principle and Practice, James D. Foley, Andries van Dam, Steven K. Feiner, John Hughes, Morgan McGuire, David F. Sklar, and Kurt Akeley.
5. WebGL 2.0 Specification at khronos.org.
6. The OpenGL® Shading Language Manual, John Kessenich, Dave Baldwin, and Randi Rost.
CS677 - Topics in Large Data Analysis and Visualization (Autumn 2023, Autumn 2024)
Click for more details
Prerequisites:
Instructor’s consentCourse Description:
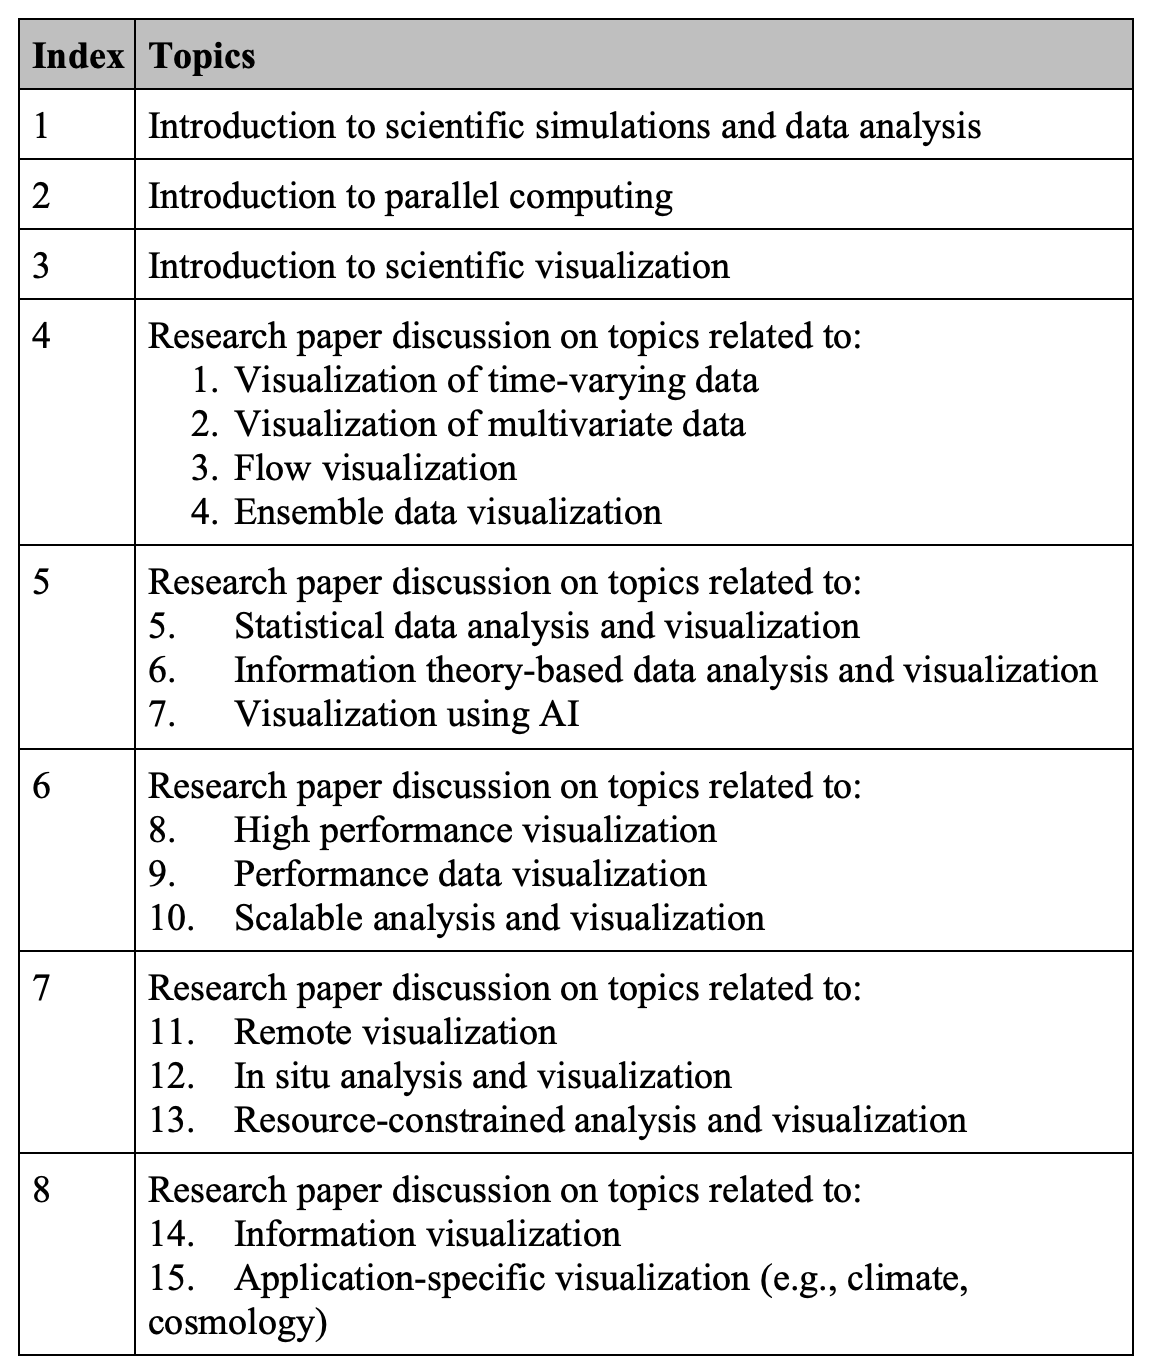
Effective analysis and visualization of large-scale data can help users to comprehend the salient patterns and features in their data quickly. Modern high-resolution scientific simulations produce gigabytes to terabytes of data. Contemporary petaflop machines result in orders of magnitude higher data production rate as compared to data consumption rate. The data generation rate will soon reach exascale. To deal with extreme-scale data, the high performance computing and visualization community has been developing novel scalable data analysis and visualization algorithms. As part of this course, we will study research papers that demonstrate big data analysis and visualization techniques from the last decade or so. This course will also focus on state-of-the-art parallel and high performance data visualization techniques. The contents of this course will be based on research papers from top-tier journals and conferences such as IEEE TVCG, CGF, IEEE/ACM Supercomputing, IEEE Visualization, IEEE TPDS, IJHPCA, IEEE LDAV, EGPGV, EuroVis and EuroGraphics, IEEE Pacific Visualization, etc.(Tentative) Course Contents:
Books, References, and Resources:
1. In Situ Visualization for Computational Science, Springer International Publishing, 2022.2. High Performance Visualization, Enabling Extreme-Scale Scientific Insight, Edited By E. Wes Bethel, Hank Childs, Charles Hansen, CRC Press, 2012.
3. Scientific Visualization: Uncertainty, Multifield, Biomedical, and Scalable Visualization, Editors: Charles D. Hansen, Min Chen, Christopher R. Johnson, Arie E. Kaufman, Hans Hagen, Springer Publications, 2014.
4. Contemporary High Performance Computing: From Petascale toward Exascale, Volume Two, Chapman & Hall/CRC, 2015.
5. Information Theory Tools for Visualization By Min Chen, Miquel Feixas, Ivan Viola, Anton Bardera, Han-Wei Shen, Mateu Sbert, by A K Peters/CRC Press, 2017.