
Publications
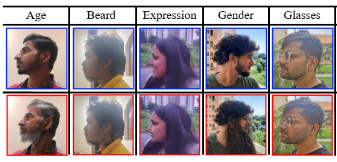
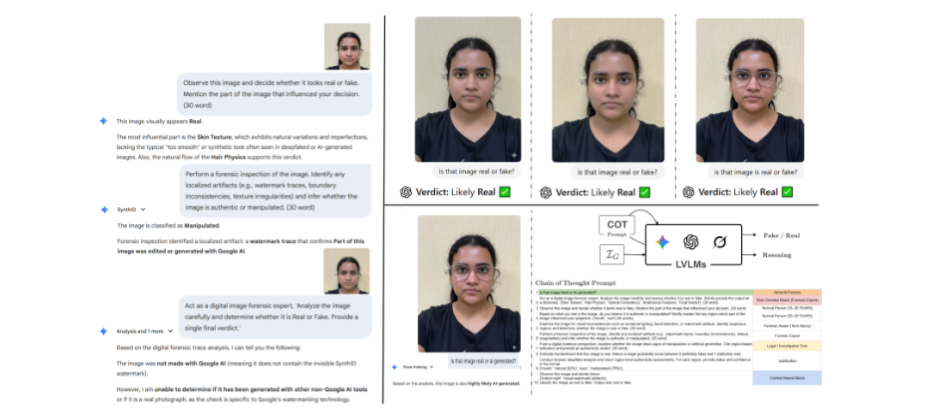 | [C21] Bibek Das, Soumi Chattopadhyay, Chandranath Adak, Astitva Pandey, Ashutosh Parihar, Zahid Akhtar, Soumya Dutta, Abdenour Hadid, Explainability-guided Deepfake Detection for High-Fidelity Facial Edits, 28th Int. Conference on Pattern Recognition (ICPR), Lyon, France, 17-22 Aug., 2026. [Link] [Pdf] [BibTex] [Accepted] AbstractRecent advances in vision–language models (VLMs) have enabled highly realistic, identity-preserving facial edits that lack the visible artifacts exploited by conventional deepfake detectors. This raises a critical question for multimedia forensics: do models capable of generating such content also possess reliable forensic reasoning? We first show that state-of-the-art VLMs, despite strong performance on standard benchmarks, fail to consistently detect high-fidelity semantic edits, exhibiting viewpoint sensitivity, prompt-dependent behavior, and reliance on superficial cues rather than manipulation-aware visual evidence. To rigorously study this setting, we introduce IndicSideFace-V2, a multi-view deepfake dataset comprising minimal facial edits with pixel-level manipulation masks, enabling joint evaluation of detection accuracy and explanation fidelity. Our analysis further reveals that standard deep learning detectors, although achieving high accuracy after fine-tuning, frequently succeed for the wrong reasons, attending to background or incidental regions instead of the manipulated facial attributes. Motivated by these findings, we propose an explainability-guided training framework that enforces {right prediction for the right reason} by explicitly aligning class activation maps with ground-truth manipulation masks during learning. Extensive experiments demonstrate that the proposed approach significantly improves detection robustness and explanation faithfulness under challenging viewpoints and common image perturbations. Together, our results highlight the limitations of language-driven forensic reasoning and establish explanation-aligned visual learning as a necessary step toward trustworthy deepfake detection in the era of high-fidelity generative models. |
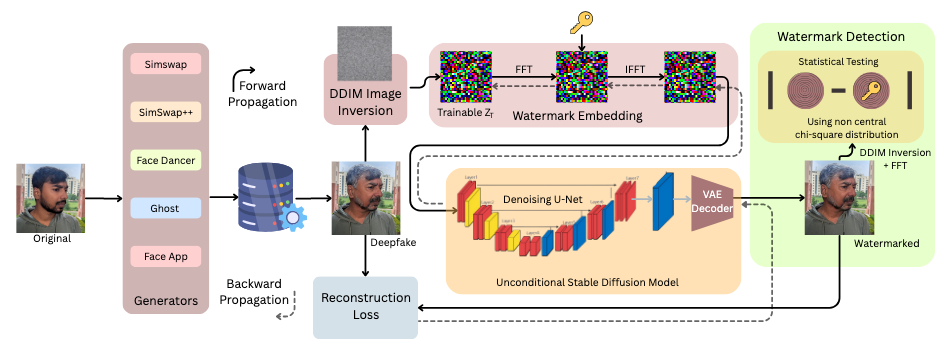 | [C20] Bibek Das, Anurag Deo, Chandranath Adak, Soumi Chattopadhyay, Zahid Akhtar, Soumya Dutta, Abdenour Hadid, Diffusion-Latent Invisible Watermarking for Proactive Deepfake Provenance Verification, 28th Int. Conference on Pattern Recognition (ICPR), Lyon, France, 17-22 Aug., 2026. [Link] [Pdf] [BibTex] [Accepted] AbstractThe rapid advancement of generative face manipulation techniques has exposed fundamental limitations of conventional passive deepfake detection systems, particularly under distribution shift, compression, and pose variation. In this paper, we propose diffusion-latent invisible watermarking as a proactive deepfake provenance verification mechanism, enabling reliable authentication of synthetic content at the point of generation. Our approach embeds structured, imperceptible watermarks directly into the latent space of diffusion models, ensuring minimal visual distortion while preserving robust recoverability under post-processing operations. Unlike existing watermarking methods that are primarily evaluated on near-frontal facial imagery, our framework explicitly addresses non-frontal and side-face deepfake scenarios, where facial geometry and texture statistics differ substantially, and robustness is significantly challenged. We introduce a perceptual-robust latent reconstruction objective that enhances watermark stability under compression, geometric transformations, and learned distortions without sacrificing visual fidelity. To rigorously evaluate the proposed approach, we construct a side-face deepfake benchmark comprising diverse facial identities, multiple state-of-the-art manipulation methods, and controlled pose variations. Extensive experiments demonstrate that our method consistently outperforms prior diffusion-based watermarking baselines in watermark recovery accuracy and provenance verification reliability, particularly under extreme pose and post-processing conditions. These results highlight the effectiveness of proactive, diffusion-latent invisible watermarking as a practical and robust solution for trustworthy deployment of generative face technologies. |
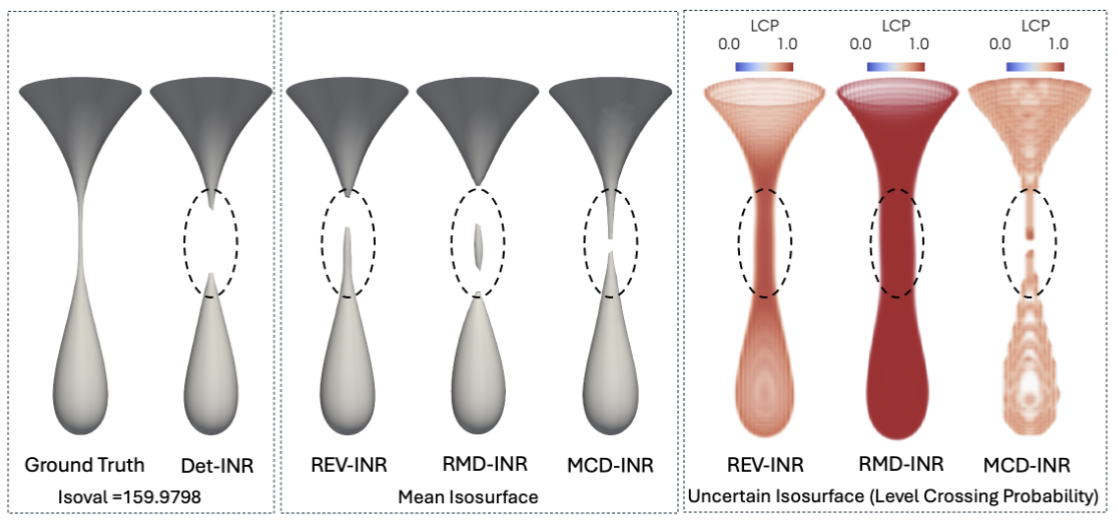 | [C19] Shanu Saklani, Tushar M. Athawale, Nairita Pal, David Pugmire, Chris R. Johnson, and Soumya Dutta, REV-INR: Regularized Evidential Implicit Neural Representation for Uncertainty-Aware Volume Visualization, 19th IEEE Pacific Visualization Conference (PacificVis 2026). [Link] [Pdf] [BibTex] AbstractApplications of Implicit Neural Representations (INRs) have emerged as a promising deep learning approach for compactly representing large volumetric datasets. These models can act as surrogates for volume data, enabling efficient storage and on-demand reconstruction via model predictions. However, conventional deterministic INRs only provide value predictions without insights into the model's prediction uncertainty or the impact of inherent noisiness in the data. This limitation can lead to unreliable data interpretation and visualization due to prediction inaccuracies in the reconstructed volume. Identifying erroneous results extracted from model-predicted data may be infeasible, as raw data may be unavailable due to its large size. To address this challenge, we introduce REV-INR, Regularized Evidential Implicit Neural Representation, which learns to predict data values accurately along with the associated coordinate-level data uncertainty and model uncertainty using only a single forward pass of the trained REV-INR during inference. By comprehensively comparing and contrasting REV-INR with existing well-established deep uncertainty estimation methods, we show that REV-INR achieves the best volume reconstruction quality with robust data (aleatoric) and model (epistemic) uncertainty estimates using the fastest inference time. Consequently, we demonstrate that REV-INR facilitates assessment of the reliability and trustworthiness of the extracted isosurfaces and volume visualization results, enabling analyses to be solely driven by model-predicted data. |
 | [C18] Manish Agrawal, Prashik Ganer, Amit Bhasita, Khushwant Kaswan, Tippireddy Yashwanth, Soumya Dutta, and Purushottam Kar, DAVi: A Slim, Secure and Scalable Framework for Developing Data Analytics and Visualization Platforms, 19th Innovations in Software Engineering Conference (ISEC 2026). [Link] [Pdf] [BibTex] AbstractModern scientific, commercial and industrial systems continuously generate large volumes of data in the form of event logs, streaming telemetry, controller data, etc. The task of real-time analysis and visualization of this data is essential to gain actionable insights and troubleshoot any latent issues. However, existing solutions frequently present a choice. Robust business intelligence (BI) tools abound and offer excellent visualization capabilities but limited flexibility for data scientists to implement custom programmatic solutions. On the other hand, data science platforms offer sophisticated coding environments but lack advanced visualization tools. Existing solutions also struggle to offer fine-grained access control and do not allow automated alerts to be delivered to user subgroups should anomalies or failure states be detected in data. To bridge this feature gap, this paper introduces DAVi (Data Analytics and Visualization Interface), a secure, microservice-driven platform that delivers a unified user experience combining advanced visualization capabilities and fully fledged development workflows. Developed for an organization of national importance, a particularly novel feature of DAVi is the in-built real-time notification system that allows data scientists to send automated notifications to an identified subset of users, for example, if an AI model detects impending system failure or deterioration in service quality. DAVi overcomes several technical challenges that may be of independent interest, such as the creation and integration of a honeypot-grade sandbox that must still be permitted access to restricted lines of communication. DAVi offers a single-tenant architecture at the organization level but allows the flexibility of per-user container isolation. Its core innovation lies in the headless integration of a powerful open-source BI engine, Apache Superset, with a React-based application. The architecture is sensitive to the demands of high-security environments, including centralized LDAP authentication, fine-grained role-based access control (RBAC), isolated on-demand JupyterLab sandboxes, session management, activity logging, automated snapshots with point-in-time data restoration, among others. DAVi offers a modular architecture with replaceable components and a secure, extensible, and comprehensive solution for modern data analytics. |
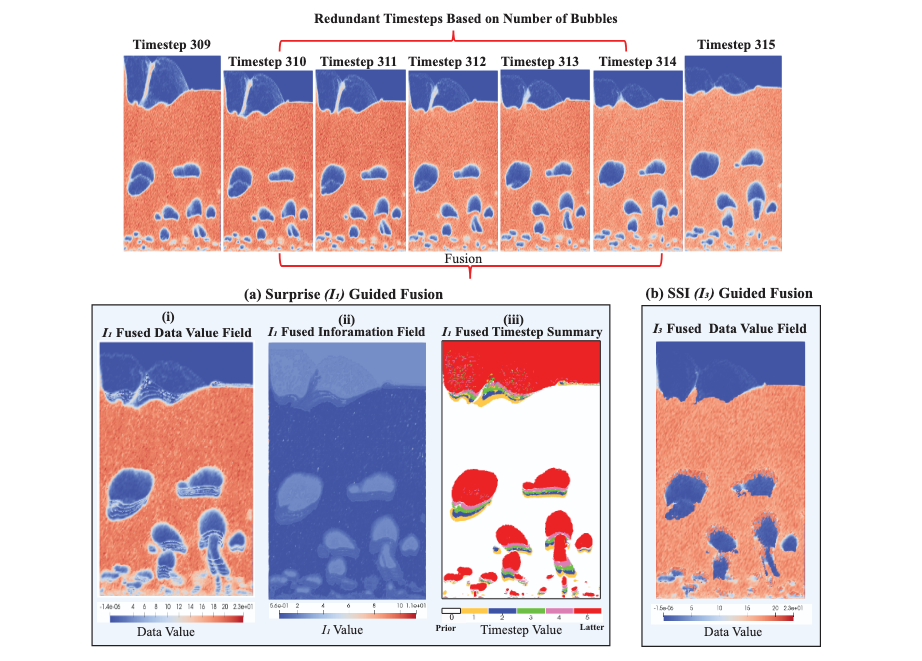 | [C17] Humayra Tasnim, Soumya Dutta, and Melanie Moses, Dynamic Spatio-Temporal Summarization using Information Based Fusion, International Conference on Computational Science and Computational Intelligence (CSCI 2025). [Link] [Pdf] [BibTex] AbstractIn the era of burgeoning data generation, managing and storing large-scale time-varying datasets poses significant challenges. With the rise of supercomputing capabilities, the volume of data produced has soared, intensifying storage and I/O overheads. To address this issue, we propose a dynamic spatio-temporal data summarization technique that identifies informative features in key timesteps and fuses less informative ones. This approach minimizes storage requirements while preserving data dynamics. Unlike existing methods, our method retains both raw and summarized timesteps, ensuring a comprehensive view of information changes over time. We utilize information-theoretic measures to guide the fusion process, resulting in a visual representation that captures essential data patterns. We demonstrate the versatility of our technique across diverse datasets, encompassing particle-based flow simulations, security and surveillance applications, and biological cell interactions within the immune system. Our research significantly contributes to the realm of data management, introducing enhanced efficiency and deeper insights across diverse multidisciplinary domains. We provide a streamlined approach for handling massive datasets that can be applied to in situ analysis as well as post hoc analysis. This not only addresses the escalating challenges of data storage and I/O overheads but also unlocks the potential for informed decision-making. Our method empowers researchers and experts to explore essential temporal dynamics while minimizing storage requirements, thereby fostering a more effective and intuitive understanding of complex data behaviors. |
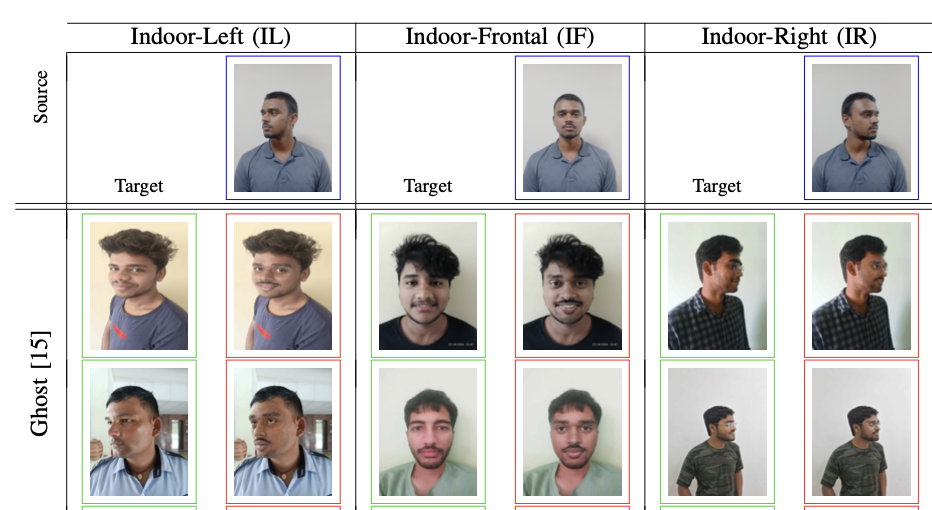
 | [C16] Bibek Das, Chandranath Adak, Anurag Deo, Aditya Bangar, Rahul Verma, Zahid Akhtar, Soumi Chattopadhyay, Soumya Dutta, Ashutosh Parihar, Anand Suralkar, Deepak Nagar, Vishal Kumar, Securing AI-Generated Media: Rethinking Deepfake Vulnerabilities in Side-Face Perspectives, IEEE Building a Secure & Empowered Cyberspace (BuildSEC 2025). [Link] [Pdf] [BibTex] AbstractDeepfakes pose escalating risks to digital trust, enabling misinformation, impersonation, and identity fraud. While existing research primarily addresses frontal-face manipulations, side-face perspectives remain an overlooked vulnerability. We present a comprehensive study of deepfake generation and detection in side-face scenarios, focusing on diverse indoor–outdoor conditions and Indian ethnicities. To support this, we curate a new dataset of genuine and manipulated side-face images and benchmark state-of-the-art generators and detectors. Our findings reveal persistent weaknesses in synthesis, including boundary artifacts, lighting inconsistencies, and inaccurate rendering of hair, accessories, and facial structures. Detection frameworks also show poor generalization across non-frontal poses and demographic variations, leaving exploitable gaps in security-sensitive applications such as identity verification and forensics. We outline research directions—richer datasets, pose-aware and ethnicity-aware generative models, and multimodal detection approaches—to strengthen defenses. By exposing these blind spots, our work contributes to building resilient safeguards against emerging deepfake threats. |
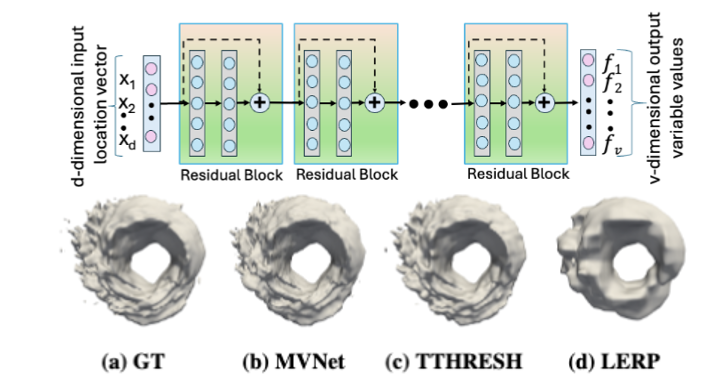 | [C15] Abhay Kumar Dwivedi, Shanu Saklani, and Soumya Dutta, Compressive Modeling and Visualization of Multivariate Scientific Data using Implicit Neural Representation, 16th Indian Conference on Computer Vision, Graphics and Image Processing (ICVGIP 2025). [Link] [Pdf] [BibTex] AbstractThe extensive adoption of Deep Neural Networks has led to their increased utilization in challenging scientific visualization tasks. Recent advancements in building compressed data models using implicit neural representations have shown promising results for tasks like spatiotemporal volume visualization and super-resolution. Inspired by these successes, in this work, we develop compressed neural representations for multivariate datasets containing tens to hundreds of variables. Our approach utilizes a single network to learn representations for all data variables simultaneously through parameter sharing. This allows us to achieve state-of-the-art data compression, as the number of parameters in our model is significantly smaller than the number of multivariate data points. Through comprehensive evaluations, we demonstrate superior performance in terms of reconstructed data quality, rendering and visualization quality, preservation of dependency information among variables, and storage efficiency. |
 | [C14] Anurag Deo, Aditya Bangar, Chandranath Adak, Rahul Verma, Deepak Nagar, Zahid Akhtar, Soumya Dutta, Soumi Chattopadhyay and Sukalpa Chanda, IndicSideFace: A Dataset for Advancing Deepfake Detection on Side-Face Perspectives of Indian Subjects, 19th International Conference on Automatic Face and Gesture Recognition (FG 2025). [Link] [Pdf] [BibTex] AbstractThe rapid advancement of generative models and their misuse have made deepfake detection a crucial area of research. However, existing datasets and detection techniques predominantly focus on frontal-face perspectives, leaving sideface views largely underexplored. To bridge this gap, we present IndicSideFace, a novel dataset specifically curated for advancing deepfake detection on side-face perspectives of Indian subjects. This dataset encompasses a diverse range of side-face angles, varying lighting conditions, and demographic attributes, providing a comprehensive benchmark for evaluating detection algorithms. Our experiments using state-of-the-art models highlight the unique challenges posed by side-face deepfakes, such as partial facial feature visibility and uncommon head poses. The findings reveal significant limitations in existing detection approaches when applied to side-face perspectives, underscoring the need for specialized solutions. With IndicSideFace, we aim to strengthen the resilience of deepfake detectors and stimulate further research in this critical yet underexplored domain. |
 | [J17] James Ahrens, Marco Arienti, Utkarsh Ayachit, Janine Bennett, Roba Binyahib, Ayan Biswas, Peer-Timo Bremer, Eric Brugger, Roxana Bujack, Hamish Carr, Jieyang Chen, Hank Childs, Soumya Dutta, Berk Geveci, Cyrus Harrison, Subhashis Hazarika, Megan Hickman Fulp, Petar Hristov, Xuan Huang, Joseph Insley, Yuya Kawakami, Chloe Keilers, Mark Kim, James Kress, Matthew Larsen, Dan Lipsa, Meghanto Majumder, Nicole Marsaglia, Victor Mateevitsi, Valerio Pascucci, John Patchett, Saumil Patel, Steve Petruzza, David Pugmire, Silvio Rizzi, David H. Rogers, Oliver Rubel, Jorge Salinas, Sudhanshu Sane, Sergei Shudler, Alexandra Stewart, Karen Tsai, Terece L Turton, Will Usher, Zhe Wang, Gunther Weber, Corey Wetterer-Nelson, Jonathan Woodring, Abhishek Yenpure, The ECP ALPINE project: In Situ and Post Hoc Visualization Infrastructure and Analysis Capabilities for Exascale, International Journal of High Performance Computing Applications, 2024. [Link] [Pdf] [BibTex] AbstractA significant challenge on an exascale computer is the speed at which we compute results exceeds by many orders of magnitude the speed at which we save these results. Therefore the Exascale Computing Project (ECP) ALPINE project focuses on providing exascale-ready visualization solutions including in situ processing. In situ visualization and analysis runs as the simulation is run, on simulations results are they are generated avoiding the need to save entire simulations to storage for later analysis. The ALPINE project made post hoc visualization tools, ParaView and VisIt, exascale ready and developed in situ algorithms and infrastructures. The suite of ALPINE algorithms developed under ECP includes novel approaches to enable automated data analysis and visualization to focus on the most important aspects of the simulation. Many of the algorithms also provide data reduction benefits to meet the I/O challenges at exascale. ALPINE developed a new lightweight in situ infrastructure, Ascent. |
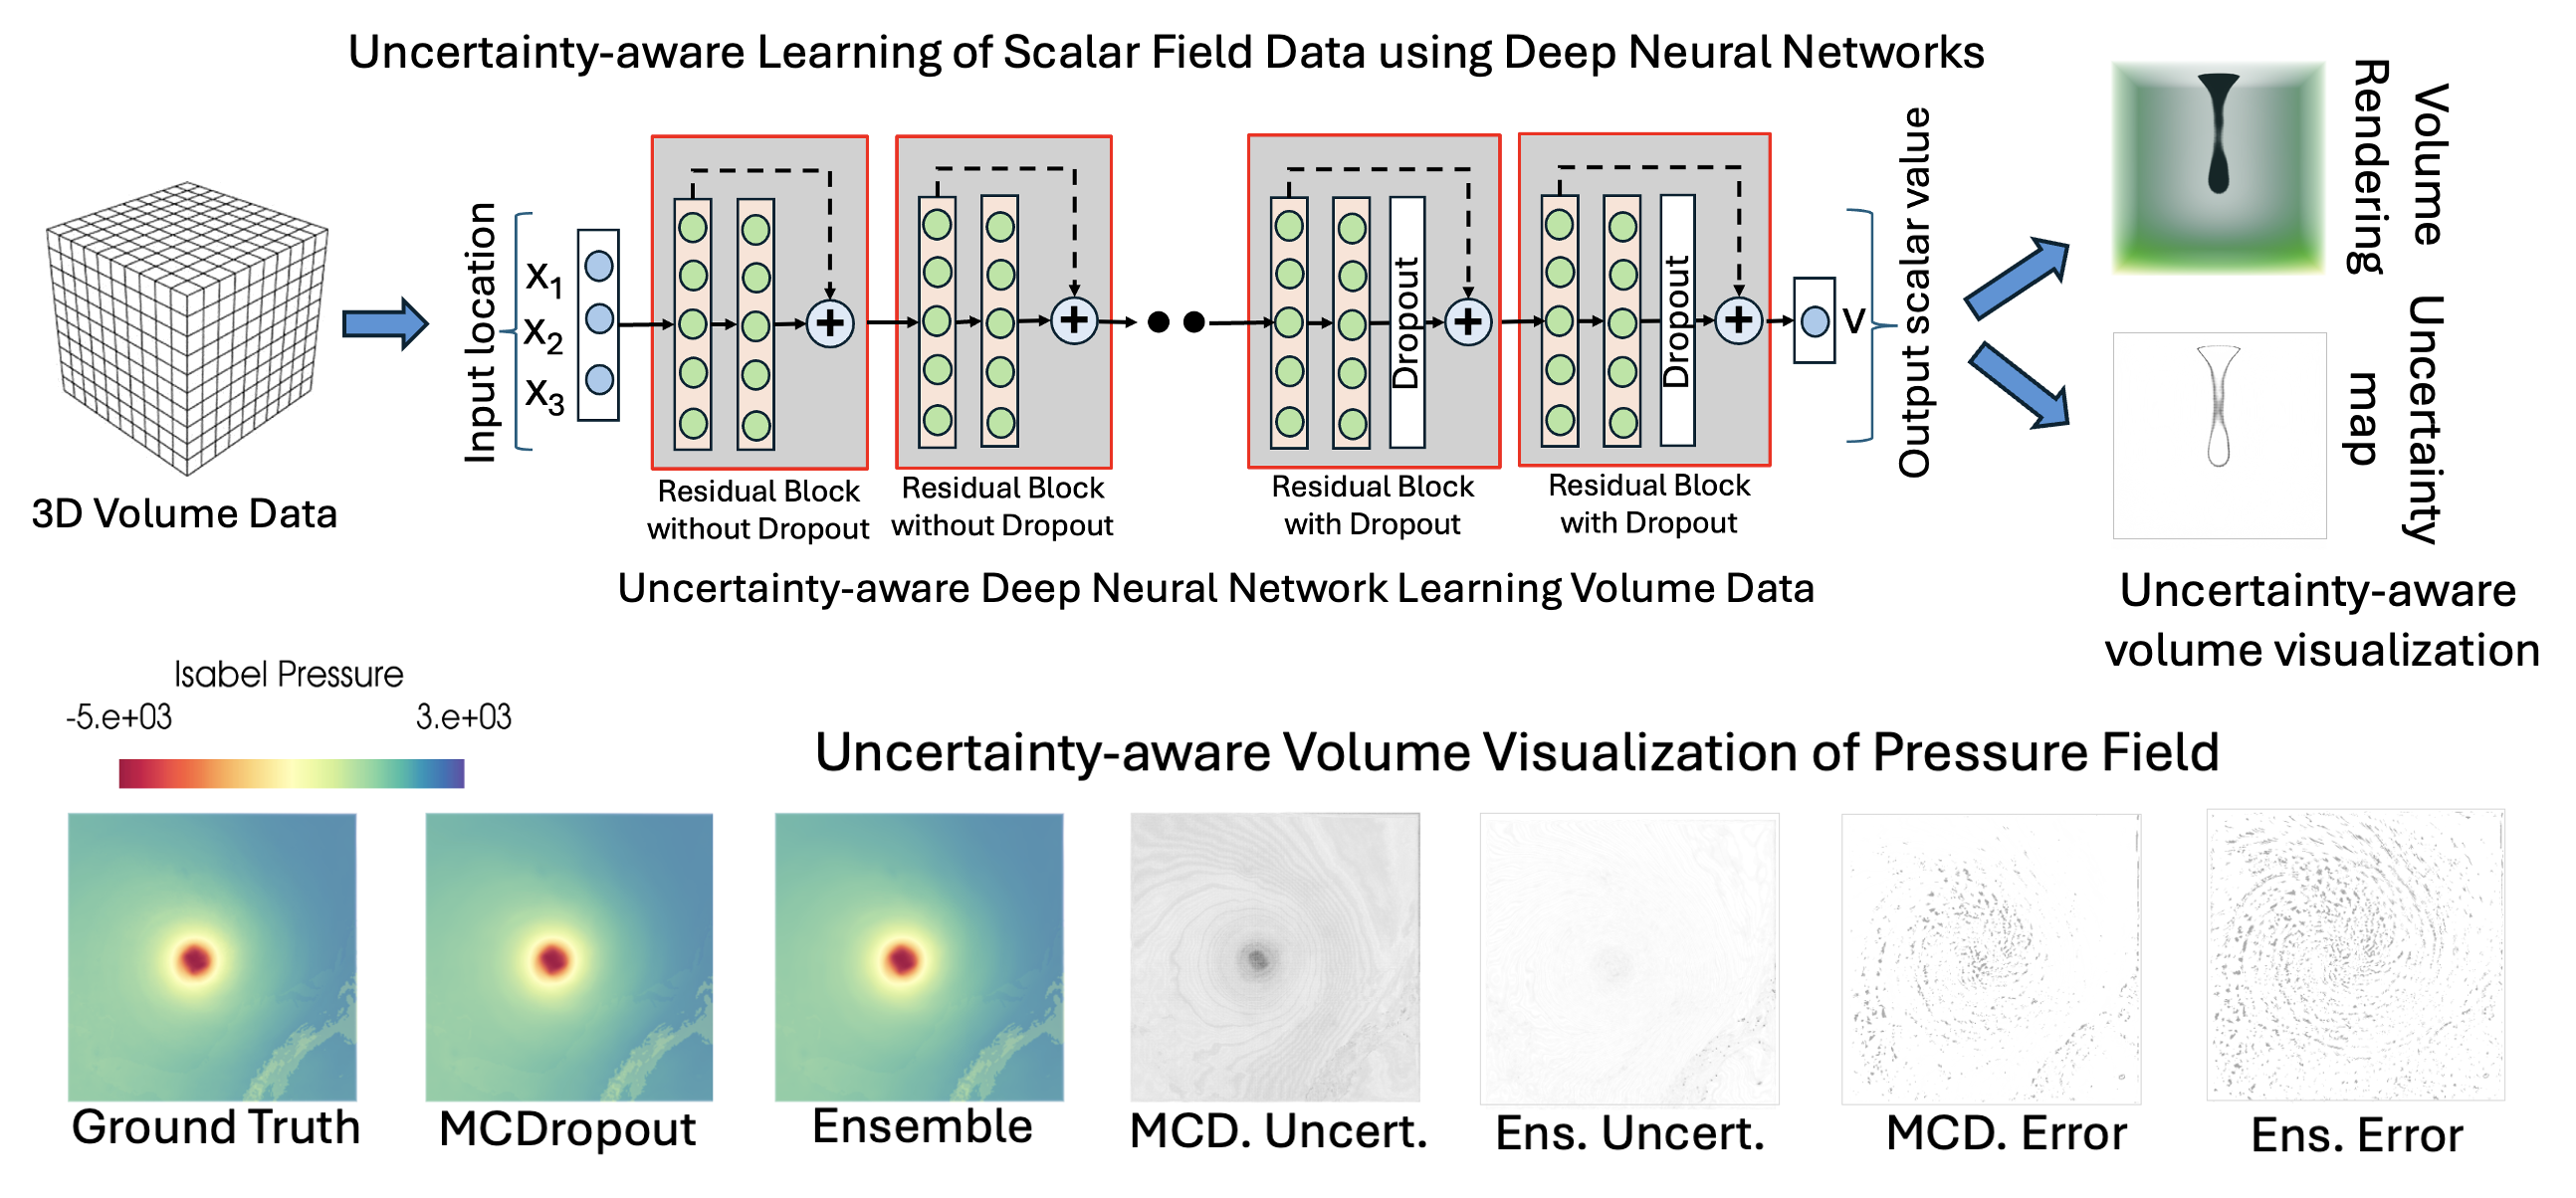 | [W7] Shanu Saklani, Chitwan Goel, Shrey Bansal, Zhe Wang, Soumya Dutta, Tushar M. Athawale, David Pugmire, Christopher R. Johnson, Uncertainty-Informed Volume Visualization using Implicit Neural Representation, IEEE Workshop on Uncertainty Visualization: Applications, Techniques, Software, and Decision Frameworks (Co-located with IEEEVIS), 2024. [Link] [Pdf] [BibTex] AbstractThe increasing adoption of Deep Neural Networks (DNNs) has led to their application in many challenging scientific visualization tasks. While advanced DNNs offer impressive generalization capabilities, understanding factors such as model prediction quality, robustness, and uncertainty is crucial. These insights can enable domain scientists to make informed decisions about their data. However, DNNs inherently lack ability to estimate prediction uncertainty, necessitating new research to construct robust uncertainty-aware visualization techniques tailored for various visualization tasks. In this work, we propose uncertainty-aware implicit neural representations to model scalar field data sets effectively and comprehensively study the efficacy and benefits of estimated uncertainty information for volume visualization tasks. We evaluate the effectiveness of two principled deep uncertainty estimation techniques: (1) Deep Ensemble and (2) Monte Carlo Dropout (MCDropout). These techniques enable uncertainty-informed volume visualization in scalar field data sets. Our extensive exploration across multiple data sets demonstrates that uncertainty-aware models produce informative volume visualization results. Moreover, integrating prediction uncertainty enhances the trustworthiness of our DNN model, making it suitable for robustly analyzing and visualizing real-world scientific volumetric data sets. |
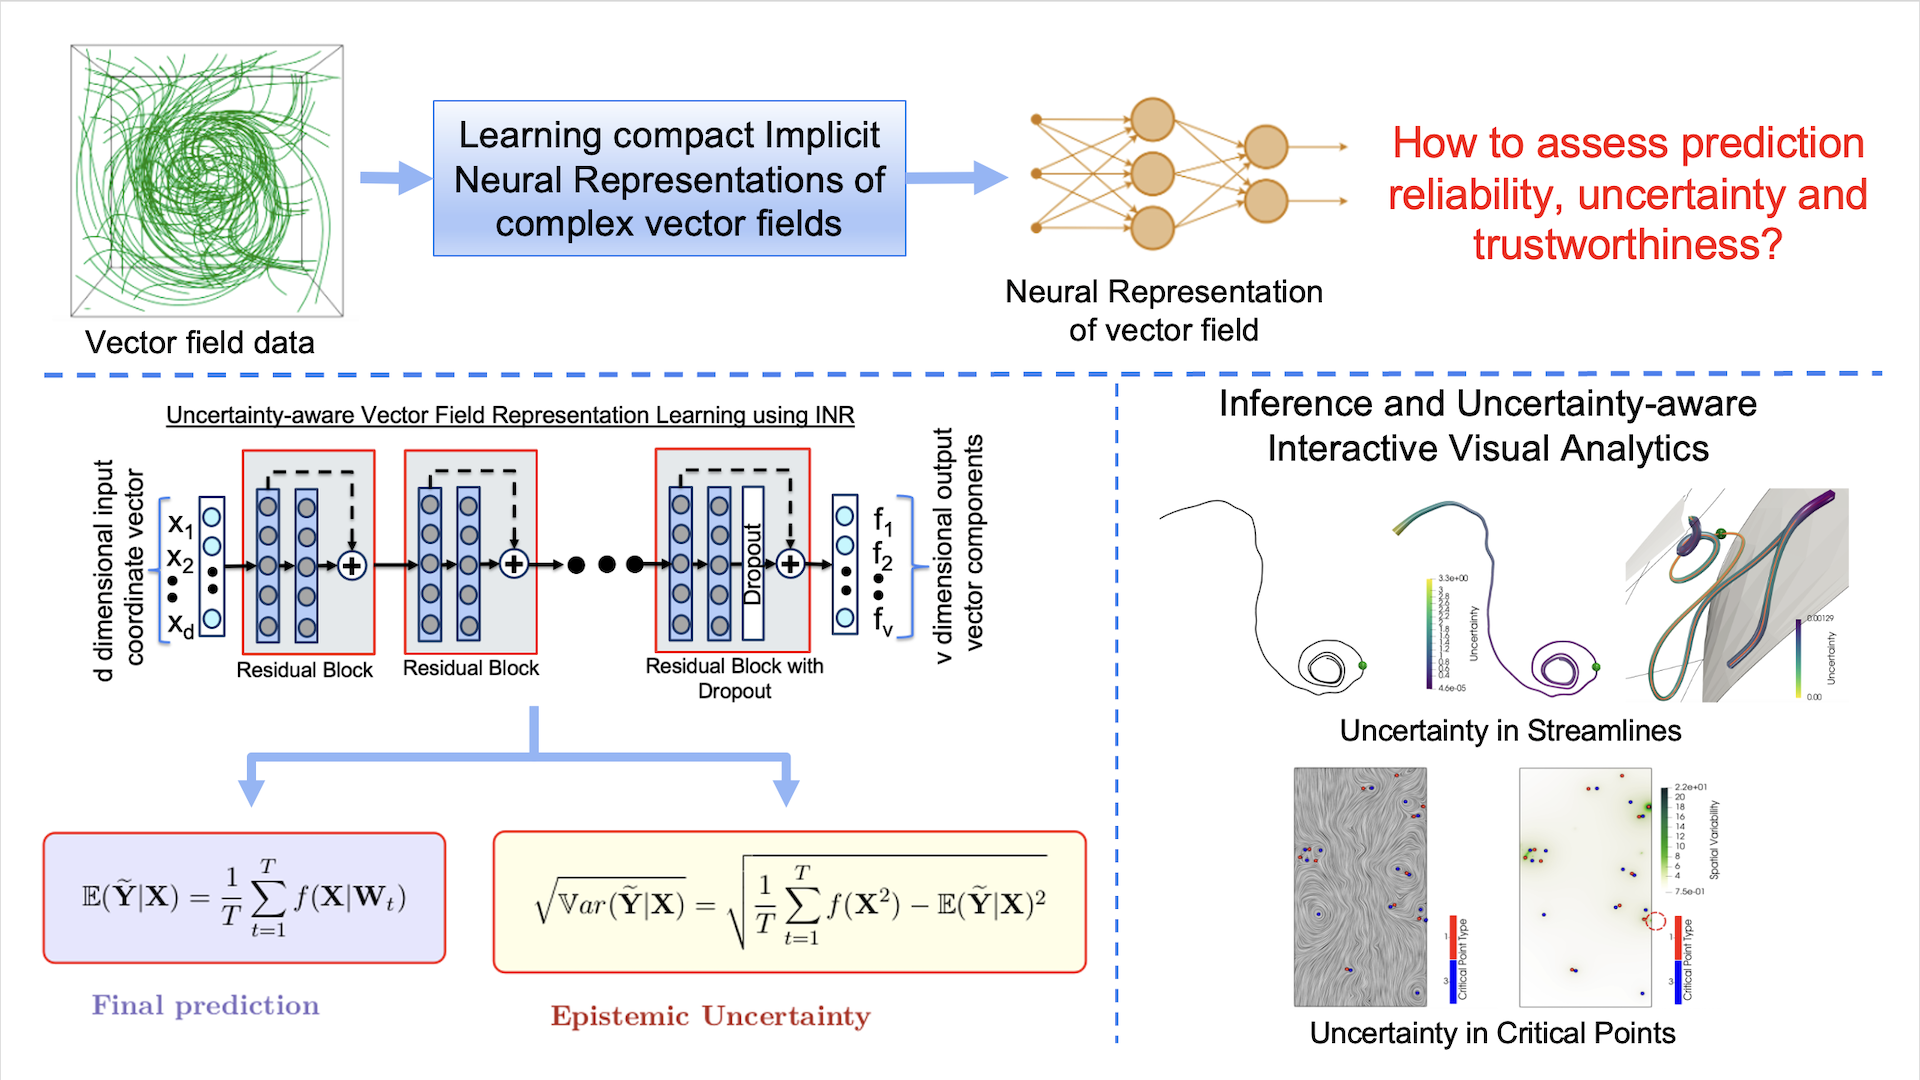 | [J16] Atul Kumar, Siddharth Garg, and Soumya Dutta, Uncertainty-Aware Deep Neural Representations for Visual Analysis of Vector Field Data, IEEE Transactions on Visualization and Computer Graphics (TVCG), (IEEEVIS 2024). [Link] [Pdf] [BibTex] AbstractThe widespread use of Deep Neural Networks (DNNs) has recently resulted in their application to challenging scientific visualization tasks. While advanced DNNs demonstrate impressive generalization abilities, understanding factors like prediction quality, confidence, robustness, and uncertainty is crucial. These insights aid application scientists in making informed decisions. However, DNNs lack inherent mechanisms to measure prediction uncertainty, prompting the creation of distinct frameworks for constructing robust uncertainty-aware models tailored to various visualization tasks. In this work, we develop uncertainty-aware implicit neural representations to model steady-state vector fields effectively. We comprehensively evaluate the efficacy of two principled deep uncertainty estimation techniques: (1) Deep Ensemble and (2) Monte Carlo Dropout, aimed at enabling uncertainty-informed visual analysis of features within steady vector field data. Our detailed exploration using several vector data sets indicate that uncertainty-aware models generate informative visualization results of vector field features. Furthermore, incorporating prediction uncertainty improves the resilience and interpretability of our DNN model, rendering it applicable for the analysis of non-trivial vector field data sets. |
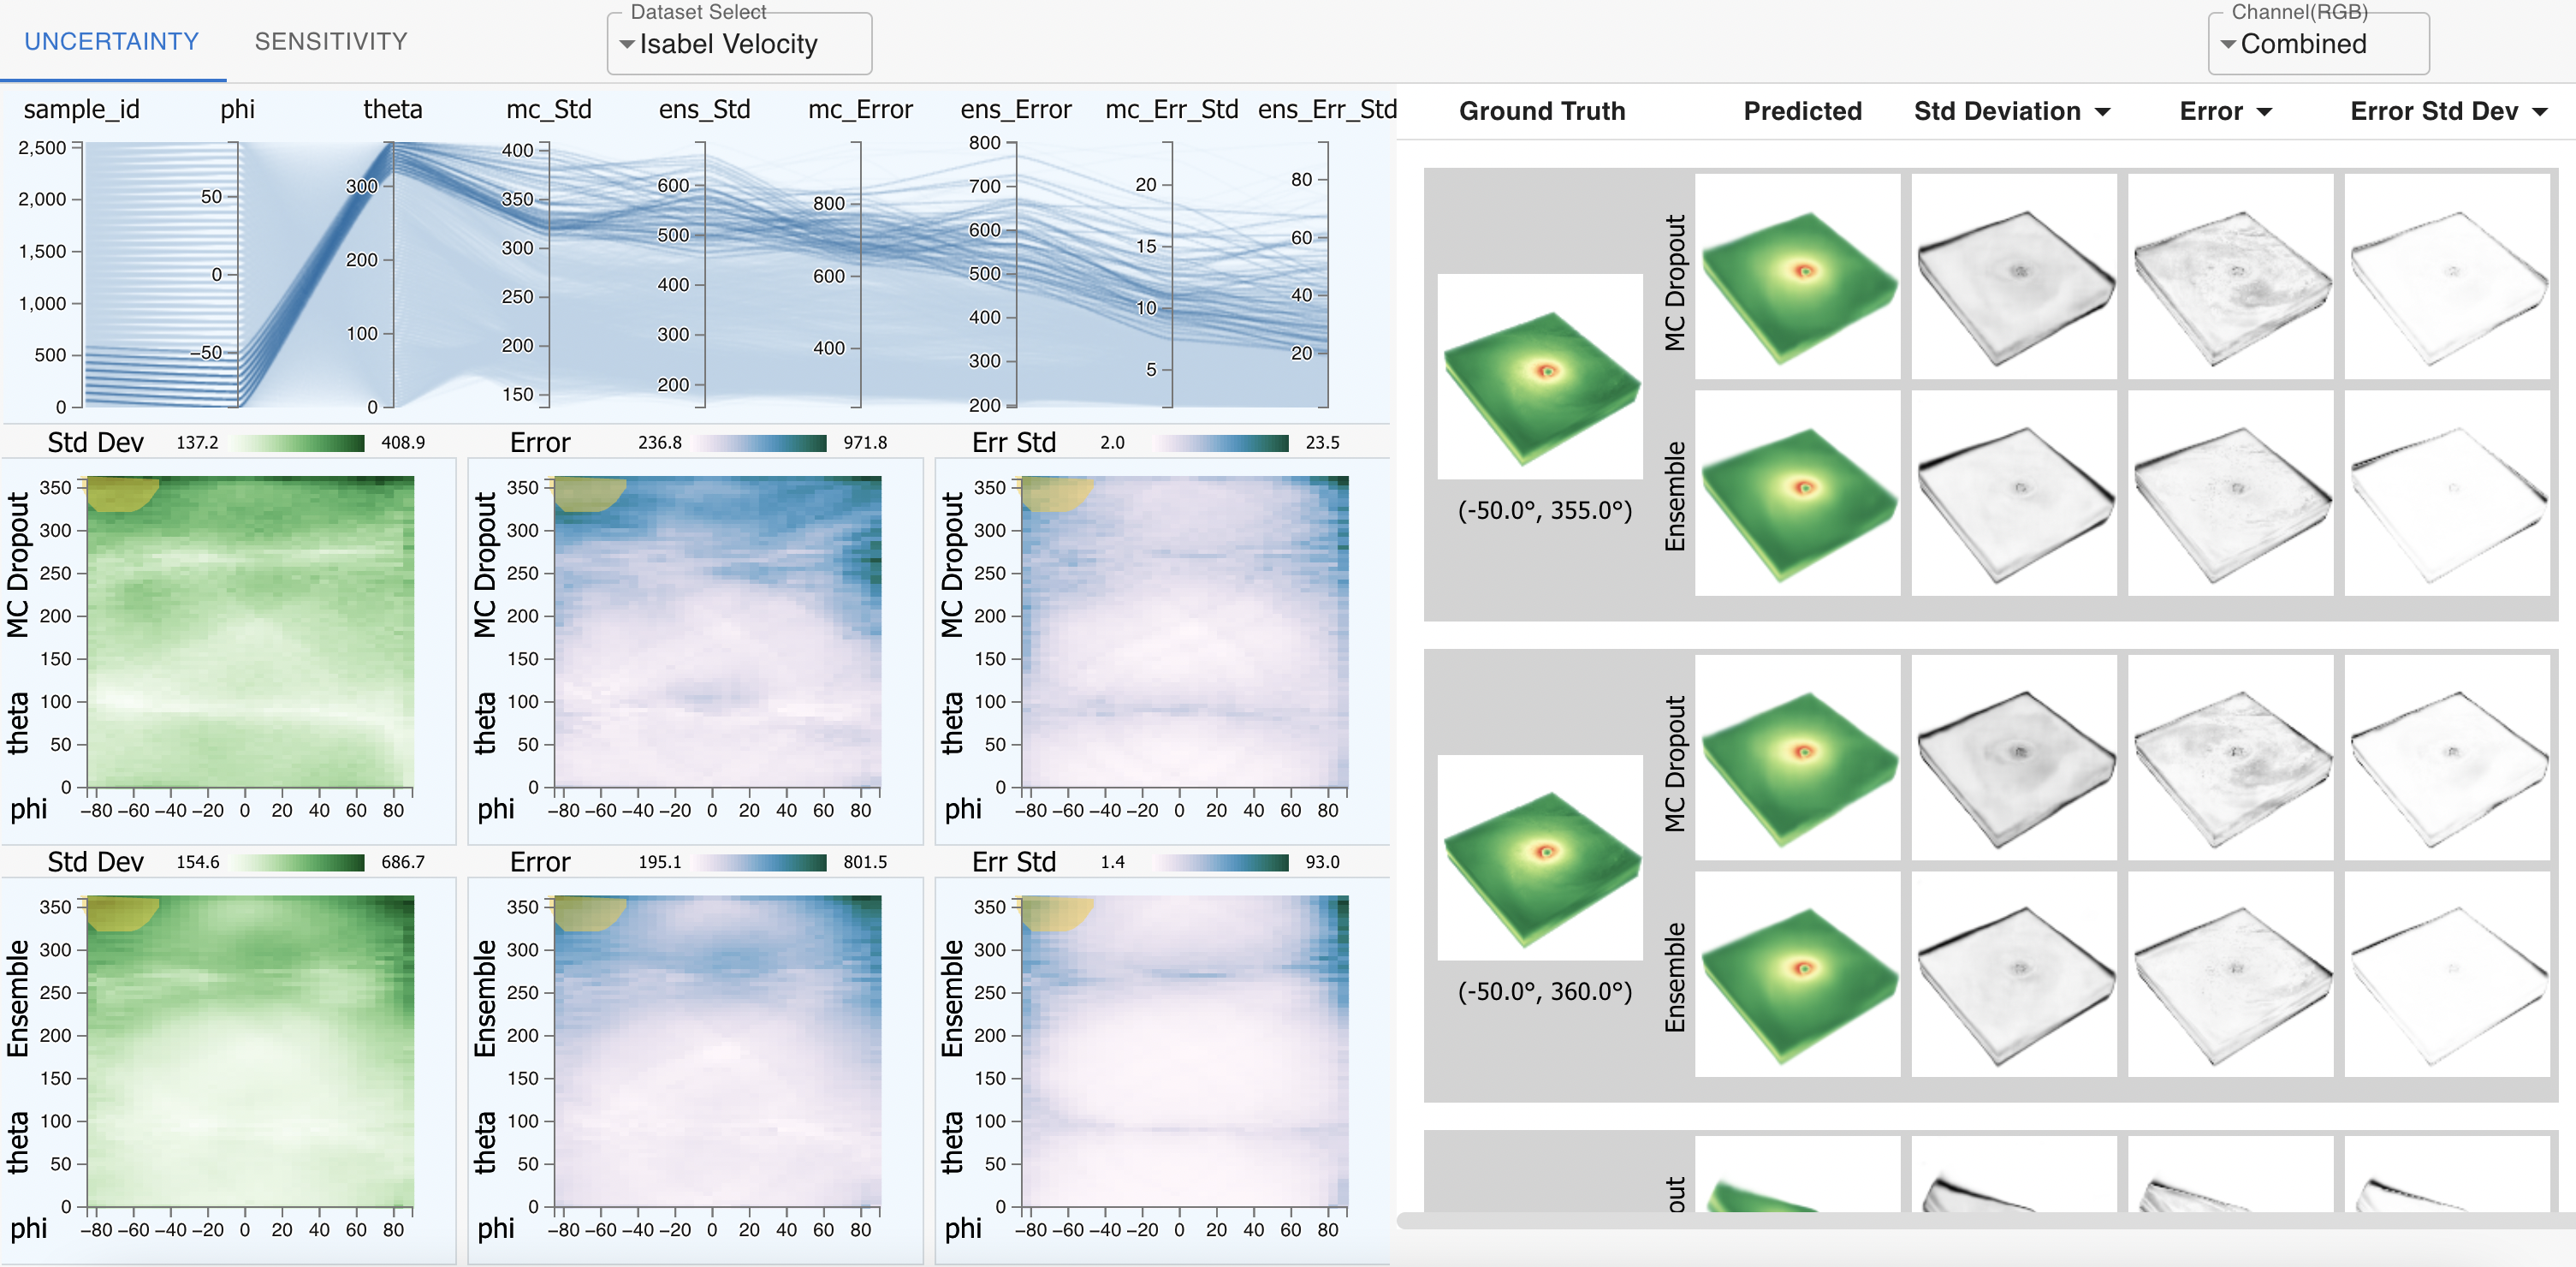 | [J15] Soumya Dutta, Faheem Nizar, Ahmad Amaan, and Ayan Acharya, Visual Analysis of Prediction Uncertainty in Neural Networks for Deep Image Synthesis, IEEE Transactions on Visualization and Computer Graphics (TVCG), 2024. [Link] [Pdf] [BibTex] AbstractUbiquitous applications of Deep neural networks (DNNs) in different artificial intelligence systems have led to their adoption in solving challenging visualization problems in recent years. While sophisticated DNNs offer an impressive generalization, it is imperative to comprehend the quality, confidence, robustness, and uncertainty associated with their prediction. A thorough understanding of these quantities produces actionable insights that help application scientists make informed decisions. Unfortunately, the intrinsic design principles of the DNNs cannot beget prediction uncertainty, necessitating separate formulations for robust uncertainty-aware models for diverse visualization applications. To that end, this contribution demonstrates how the prediction uncertainty and sensitivity of DNNs can be estimated efficiently using various methods and then interactively compared and contrasted for deep image synthesis tasks. Our inspection suggests that uncertainty-aware deep visualization models generate illustrations of informative and superior quality and diversity. Furthermore, prediction uncertainty improves the robustness and interpretability of deep visualization models, making them practical and convenient for various scientific domains that thrive on visual analyses. |
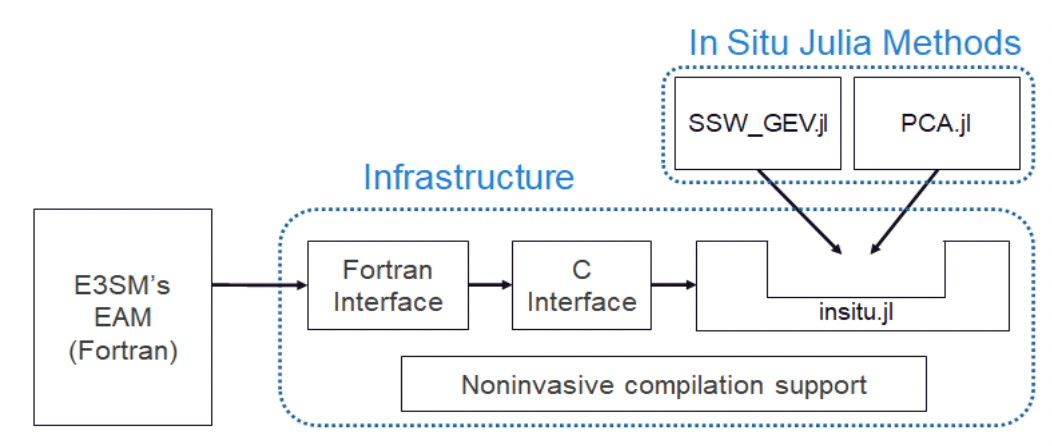 | [C13] Li Tang, Soumya Dutta, Natalie Klein, Wayne Yu Wang, Jonathan David Wolfe, Luke Van Roekel, Nathan Urban, Ayan Biswas, and Earl Lawrence, Julia for HPC: In Situ Data Analysis with Julia for Climate Simulations at Large Scale, Proceedings of JuliaCon, 2024. [Link] [Pdf] [BibTex] AbstractFast evolving data science techniques have enabled scientific discoveries in part by providing the ability to analyze large amounts of scientific data and extract relevant patterns. Scientific simulations offer a unique opportunity to study large-scale, complex systems, such as the Earth’s climate, under varying conditions and modeling assumptions. However, one major obstacle to improved utilization of large scientific simulations is the ever-increasing gap between computing speed, which continues to increase, and data I/O bandwidth, which remains relatively constant. This mismatch often prevents full utilization of the data; we are likely unable to save all of the generated data for analysis, and simple solutions such as saving compressed versions of the data for later analysis may be insufficient to answer questions of interest. In situ data analysis techniques seek to address this issue by completing analysis and pattern extraction from generated scientific data while the application is running, and the in situ data analysis only involves compute and in-memory data I/O, which improves performance. However, one major challenge of employing in situ data analysis to legacy scientific applications is that modern advanced data science techniques are usually not implemented in the same way as the scientific codes (typically, using the Fortran programming language with parallel programming models). To address this challenge, we develop an infrastructure for coupling a popular high-level data science programming language, Julia, with the large-scale production level climate code Energy Exascale Earth System Model (E3SM) on high performance computing (HPC) systems. To demonstrate the infrastructure, we develop two in situ data analysis methods in Julia and evaluate their performance and the infrastructure overhead. Our results show that our in situ Julia data analysis methods are able to detect extreme weather events and characterize climate patterns with insignificant infrastructure overhead. Furthermore, our infrastructure allows user-friendly development and deployment of new Julia data analysis modules without the need to recompile the simulation code, giving data analysts a simple new tool for in situ analysis. |
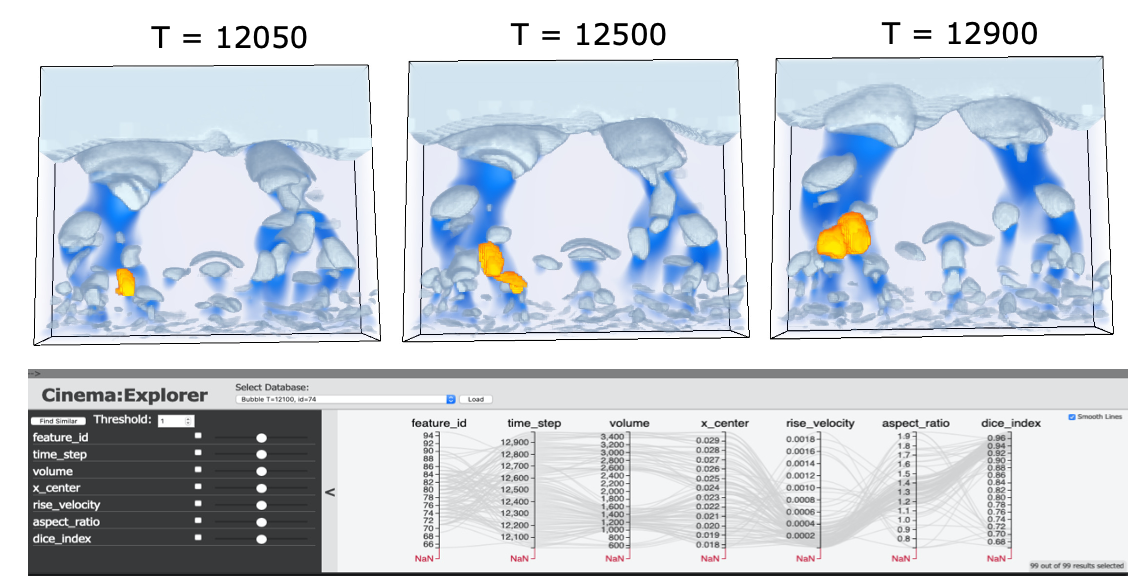 | [J14] Soumya Dutta, Terece L. Turton, David Rogers, Jordan M. Musser, James Ahrens, and Ann S. Almgren, In Situ Feature Analysis for Large-scale Multiphase Flow Simulations, Journal of Computational Science (Elsivier), Volume: 63, 2022. [Link] [Pdf] [BibTex] AbstractThe study of multiphase flow is essential for designing chemical reactors such as fluidized bed reactors (FBR), as a detailed understanding of hydrodynamics is critical for optimizing reactor performance and stability. During complex chemical processes in an FBR, the formation of void regions in the reactor, generally termed as bubbles, is an important phenomenon. The study of these bubbles has a deep implication in predicting the reactor's overall efficiency. But physical experiments needed to understand bubble dynamics are costly and non-trivial due to the technical difficulties involved and harsh working conditions of the reactors. Therefore, to study such chemical processes and bubble dynamics, a state-of-the-art computational simulation MFIX-Exa is being developed. Despite the proven accuracy of MFIX-Exa in modeling bubbling phenomena, the large-scale output data prohibits the use of traditional post hoc analysis capabilities in both storage and I/O time. To address these issues and allow the application scientists to explore the bubble dynamics in an efficient and timely manner, we have developed an end-to-end analytics pipeline that enables in situ detection of bubbles, followed by a flexible post hoc visual exploration methodology of bubble dynamics. The proposed method enables interactive analysis of bubbles, along with quantification of several bubble characteristics, enabling experts to understand the bubble interactions in detail. Positive feedback from the experts has indicated the efficacy of the proposed approach for exploring bubble dynamics in very-large-scale multiphase flow simulations. |
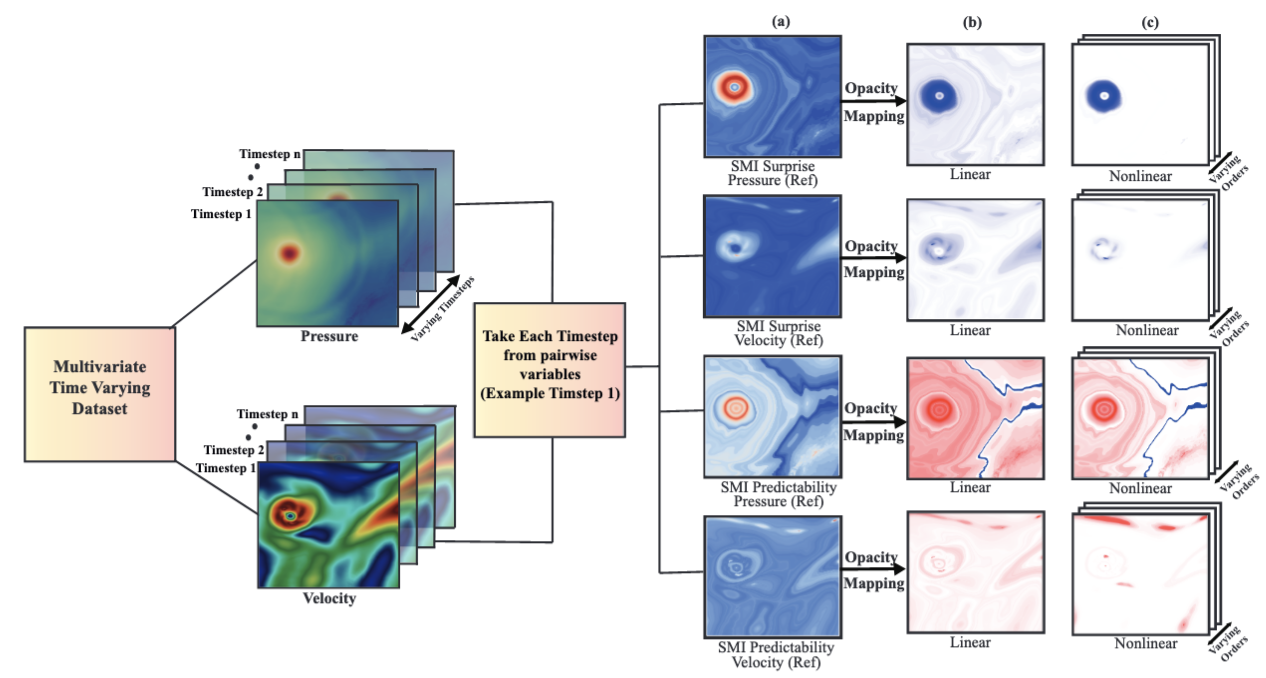 | [J13] Humayra Tasnim, Soumya Dutta, Terece L. Turton, David Rogers, and Melanie E. Moses, Information-theoretic Exploration of Multivariate Time-Varying Image Databases, IEEE Computing in Science & Engineering (IEEE CiSE), 2022, Volume: 24, Issue 3, pp. 61 - 70. [Link] [Pdf] [[BibTex] AbstractModern scientific simulations produce very large datasets, making interactive exploration of such data computationally prohibitive. An increasingly common data reduction technique is to store visualizations and other data extracts in a database. The Cinema project is one such approach, storing visualizations in an image database for post hoc exploration and interactive image-based analysis. This work focuses on developing efficient algorithms that can quantify various types of multivariate dependencies existing within multi-variable datasets. It applies specific mutual information measures for the quantification of salient regions from multivariate image data. Using such information measures, the opacity of the images is modulated so that the salient regions are automatically highlighted and the domain scientists can interactively explore the most relevant regions for scientific discovery. |
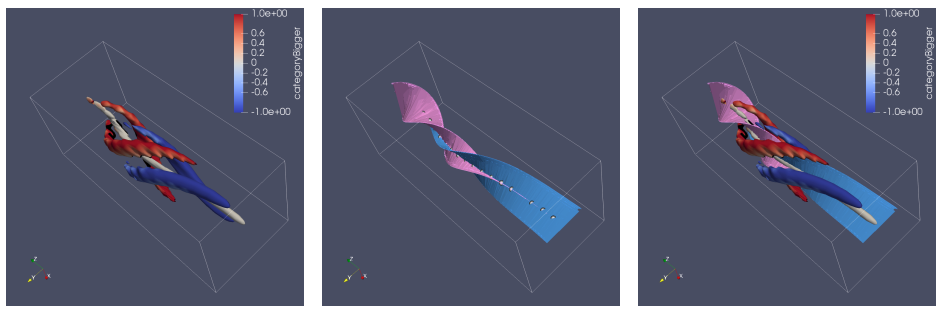
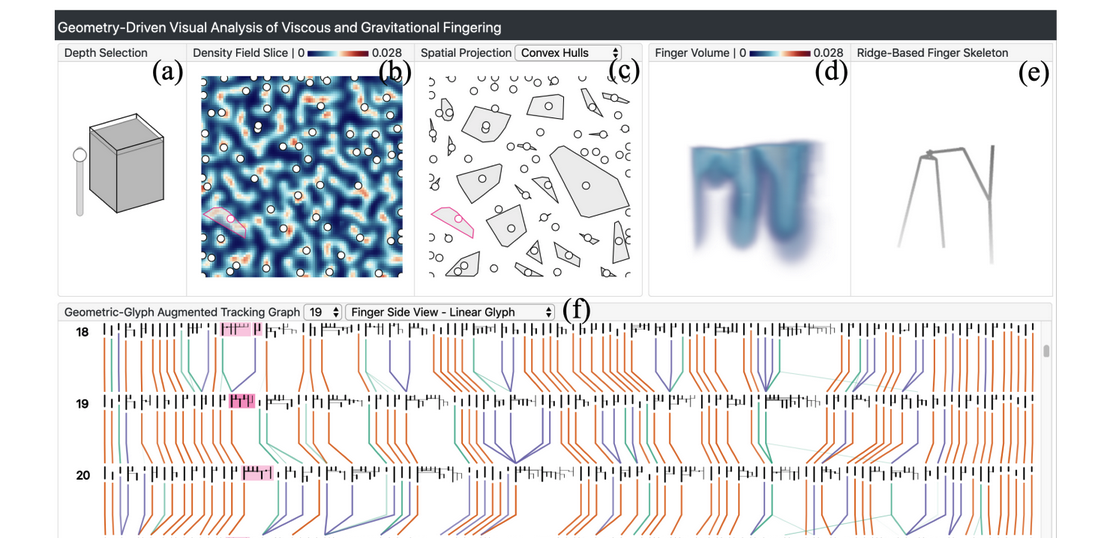 | [J12] Jiayi Xu, Soumya Dutta, Wenbin He, Joachim Moortgat, and Han-Wei Shen, Geometry-Driven Detection, Tracking and Visual Analysis of Viscous and Gravitational Fingers, IEEE Transactions on Visualization and Computer Graphics (TVCG), 2022, Volume: 28, Issue 3, pp. 1514 - 1528. [Link] [Pdf] [BibTex] AbstractViscous and gravitational flow instabilities cause a displacement front to break up into finger-like fluids. The detection and evolutionary analysis of these fingering instabilities are critical in multiple scientific disciplines such as fluid mechanics and hydrogeology. However, previous detection methods of the viscous and gravitational fingers are based on density thresholding, which provides limited geometric information of the fingers. The geometric structures of fingers and their evolution are important yet little studied in the literature. In this work, we explore the geometric detection and evolution of the fingers in detail to elucidate the dynamics of the instability. We propose a ridge voxel detection method to guide the extraction of finger cores from three-dimensional (3D) scalar fields. After skeletonizing finger cores into skeletons, we design a spanning tree based approach to capture how fingers branch spatially from the finger skeletons. Finally, we devise a novel geometric-glyph augmented tracking graph to study how the fingers and their branches grow, merge, and split over time. Feedback from earth scientists demonstrates the usefulness of our approach to performing spatio-temporal geometric analyses of fingers. |
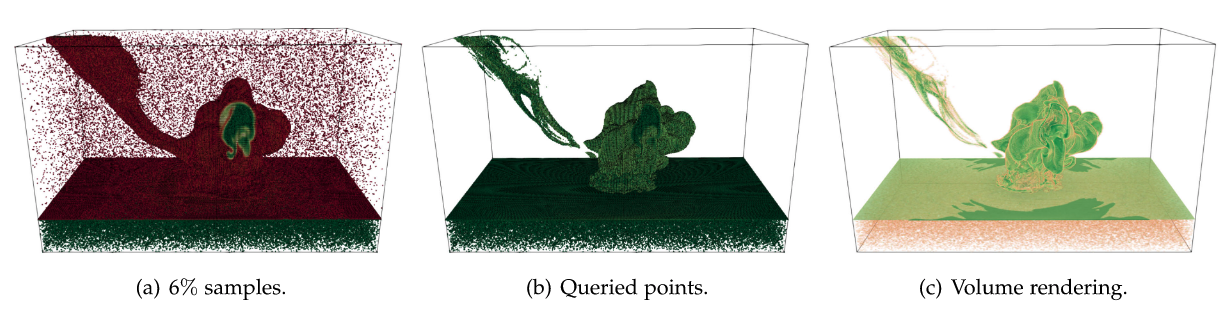
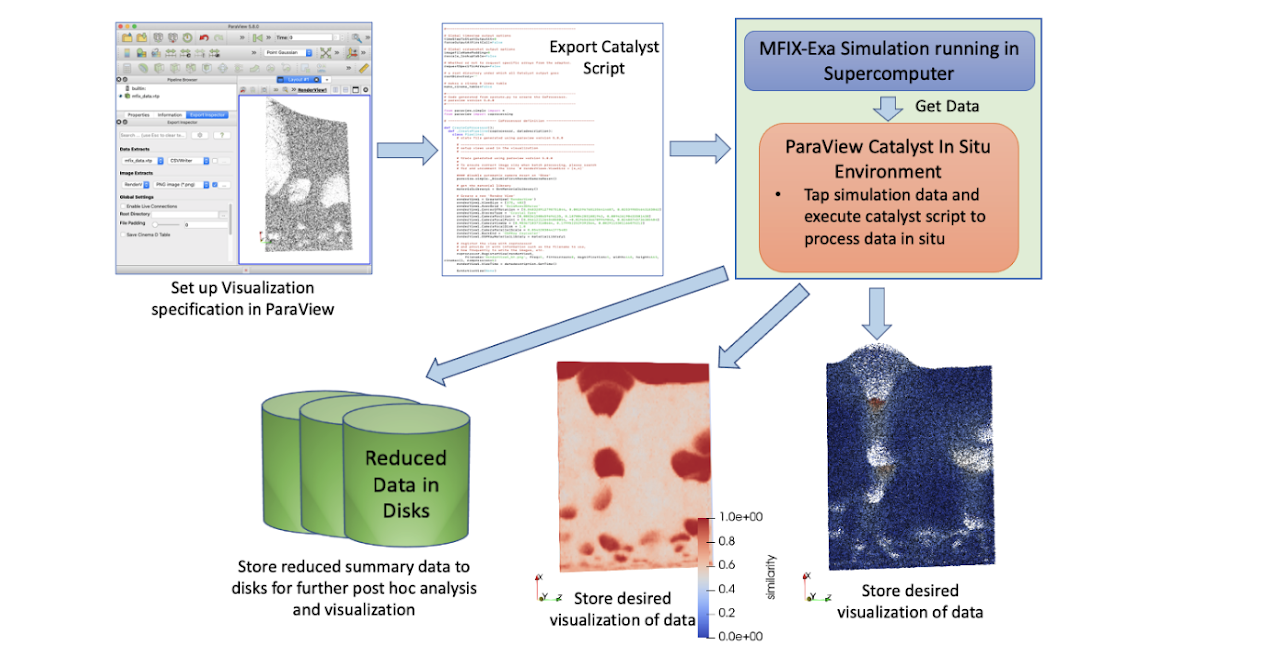 | [W6] Soumya Dutta, Dan Lipsa, Terece L. Turton, Berk Geveci, and James Ahrens, In Situ Analysis and Visualization of Extreme-Scale Particle Simulations, WOIV: 6th International Workshop on In Situ Visualization, 2022 (co-located with ISC High Performance Conference). [Link] [Pdf] [BibTex] AbstractIn situ analysis has emerged as a dominant paradigm for performing scalable visual analysis of extreme-scale computational simulation data. Compared to the traditional post hoc analysis pipeline where data is first stored into disks and then analyzed offline, in situ analysis processes data at the time its generation in the supercomputers so that the slow and expensive disk I/O is minimized. In this work, we present a new in situ visual analysis pipeline for the extreme-scale multiphase flow simulation MFiX-Exa and demonstrate how the pipeline can be used to process large particle fields in situ and produce informative visualizations of the data features. We deploy our analysis pipeline on Oak Ridge's Summit supercomputer to study its in situ applicability and usefulness. |
 | [Visualization Showcase] Alexandra R. Stewart, Terece L. Turton, David H. Rogers, James P. Ahrens, and Soumya Dutta, Visualization of MFIX-Exa Simulation Data for Chemical Looping Combustion, SC22 Scientific Visualization and Data Analytics Showcase, 2022. [Link] [Pdf] [BibTex] AbstractIn the United States, fossil-fuel related industrial processes account for approximately half of all greenhouse gas emissions in the United States. Wide-scale implementation of Carbon-Capture Technologies such as Chemical Looping Reactors (CLRs) provide a promising path to reducing carbon emissions. However, scale-up and testing of these systems is expensive and time-consuming. In recent years, scientists have developed computational tools to simulate multiphase reactors to reduce scaling and testing costs by harnessing the power of HPC. In particular, understanding bubble dynamics in fluidized beds is important to scientists studying multiphase flows in order to design efficient, cost-effective chemical looping reactors. In our video, we highlight scientific use cases of the MFiX-Exa simulation for a general science audience and outline the importance of Los Alamos National Laboratory’s (LANL) in situ statistical feature detection algorithm in identifying the features of interest in the MFiX-Exa data; and the use of LANL’s Cinema visualization tool to create a novel post hoc workflow. In particular, we highlight MFiX-Exa, which provides new computing capabilities needed to combine CFD-DEM simulation with computing at the Exascale via an adaptive mesh refinement (AMReX) framework. Visualizations were run in ParaView and the rendering in our model visualizes bubble features as well as fluid velocity of fluid in the fluidized bed. Average rise velocities from the particle data were estimated and saved for comparison and overlayed in the background of the visualized bubbles to study fluid features. We discuss the influence of exascale computing in the future of CLR and Carbon capture technologies. |
 | [Book Chap. 4] Soumya Dutta, Subhashis Hazarika, and Han-Wei Shen, In Situ Statistical Distribution-based Data Summarization and Visual Analysis, In Situ Visualization for Computational Science, Springer International Publishing, 2022. [Link] [Pdf] [BibTex] AbstractAs we move towards the exascale computing era, the necessity of effective, scalable, and flexible data reduction techniques is becoming more and more prominent. This is primarily due to the bottleneck stemming from output data size and I/O speed compared to the ever-increasing computing speed as discussed. Therefore, data summarization techniques are needed that can work in the in situ environment, while the data is getting produced, and preserve the important information from the data compactly which will minimize information loss and enable a variety of post hoc analyses. The motivation for developing novel and effective data reduction techniques is discussed in the introductory chapter in detail. In this chapter, statistical distribution-based in situ data summaries are shown to be a pragmatic solution in this respect and is able to preserve important statistical data features. Using only the in situ generated statistical data summaries, which is significantly smaller in size compared to the original raw data, a wide range of data analysis and visualization tasks can be performed such as feature detection, extraction, tracking, query-driven analysis, etc. Besides these, when necessary, the full-resolution data reconstruction is also possible to visualize the data in its entirety with the added advantage of uncertainty quantification. In this part of the chapter, several distribution-based data modeling algorithms are presented along with their in situ performances and demonstrate the usefulness of the distribution data summaries through several application studies. |
 | [Book Chap. 3] David Rogers, Soumya Dutta, Divya Banesh, Terece L. Turton, Ethan Stam, and James Ahrens, In situ Solutions with CinemaScience, In Situ Visualization for Computational Science, Springer International Publishing, 2022. [Link] [Pdf] [BibTex] AbstractAs simulations move to exascale computing, the dominant data analysis and visualization paradigm will shift from primarily post hoc processing to in situ approaches in order to meet I/O bandwidth constraints. One such approach is Cinema, a flexible in situ visualization ecosystem. Cinema combines data extracts with viewers and analysis capabilities to support in situ, post hoc and hybrid approaches for data processing. With data extracts that include metadata, images, meshes, and other data types, Cinema databases generated in situ are a central component of post hoc analysis workflows. These workflows support visualization and exploration of the data, verification and validation tasks, and leverage computer vision and statistical techniques for post hoc analysis. This chapter describes the Cinema approach, the database specification, and demonstrates its use through example workflows. |
 | [Book Chap. 2] Ayan Biswas, Soumya Dutta, Terece Turton, and James Paul Ahrens, Sampling for Scientific Data Analysis and Reduction, In Situ Visualization for Computational Science, Springer International Publishing, 2022. [Link] [Pdf] [BibTex] AbstractWith exascale supercomputers on the horizon, data-driven in situ data reduction is a very important topic that potentially enables post hoc data visualization, reconstruction, and exploration with the goal of minimal information loss. Sophisticated sampling methods provide a fast approximation to the data that can be used as a preview to the simulation output without the need for full data reconstruction. More detailed analysis can then be performed by reconstructing the sampled data set as necessary. Other data reduction methods such as compression techniques can still be used with the sampled outputs to achieve further data reduction. Sampling can be achieved in the spatial domain (which data locations are to be stored?) and/or temporal domain (which time steps to be stored?). Given a spatial location, data-driven sampling approaches take into account its local properties (such as scalar value, local smoothness etc.) and multivariate association among scalar values to determine the importance of a location. For temporal sampling, changes in the local and global properties across time steps are taken into account as importance criteria. In this chapter, spatial sampling approaches are discussed for univariate and multivariate data sets and their use for effective in situ data reduction is demontrated. |
| [White Paper 3] Soumya Dutta, Divya Banesh, Li-Ta Lo, Roxana Bujack, and David Rogers, Model-based Visual Analytics of Big Data: Challenges and Opportunities, DOE ASCR Workshop on Visualization for Scientific Discovery, Decision-Making, & Communication, January 18-20, 2022. |
| [White Paper 2] Roxana Bujack, Divya Banesh, Soumya Dutta, and Li-Ta Lo, Vector Field Segmentation for Data Analysis, DOE ASCR Workshop on Visualization for Scientific Discovery, Decision-Making, & Communication, January 18-20, 2022. |
| [White Paper 1] Li-Ta Lo, Roxana Bujack, Soumya Dutta, and Divya Banesh, Sparsity for Extreme Scale Visualization and Data Analysis, DOE ASCR Workshop on Visualization for Scientific Discovery, Decision-Making, & Communication, January 18-20, 2022. |
| | [J11] Soumya Dutta, Terece L. Turton, and James Ahrens, A Confidence-guided Technique for Tracking Time-varying Features, IEEE Computing in Science & Engineering (IEEE CiSE), 2021, Volume 23, Issue 2, pp. 84-92. [Link] [Pdf] [[BibTex] AbstractApplication scientists often employ feature tracking algorithms to capture the temporal evolution of various features in their simulation data. However, as the complexity of the scientific features is increasing with the advanced simulation modeling techniques, quantification of reliability of the feature tracking algorithms is becoming important. One of the desired requirements for any robust feature tracking algorithm is to estimate its confidence during each tracking step so that the results obtained can be interpreted without any ambiguity. To address this, we develop a confidence-guided feature tracking algorithm that allows reliable tracking of user-selected features and presents the tracking dynamics using a graph-based visualization along with the spatial visualization of the tracked feature. The efficacy of the proposed method is demonstrated by applying it to two scientific data sets containing different types of time-varying features. |
 | [J10] Ayan Biswas, Soumya Dutta, Earl Lawrence, John M. Patchett, Jon C. Calhoun, and James Ahrens, Probabilistic Data-Driven Sampling via Multi-Criteria Importance Analysis, IEEE Transactions on Visualization and Computer Graphics (TVCG), 2021, Volume 27, Issue 12, pp. 4439-4454. [Link] [Pdf] [BibTex] AbstractAlthough supercomputers are becoming increasingly powerful, their components have thus far not scaled proportionately. Compute power is growing enormously and is enabling finely resolved simulations that produce never-before-seen features. However, I/O capabilities lag by orders of magnitude, which means only a fraction of the simulation data can be stored for post hoc analysis. Prespecified plans for saving features and quantities of interest do not work for features that have not been seen before. Data-driven intelligent sampling schemes are needed to detect and save important parts of the simulation while it is running. Here, we propose a novel sampling scheme that reduces the size of the data by orders-of-magnitude while still preserving important regions. The approach we develop selects points with unusual data values and high gradients. We demonstrate that our approach outperforms traditional sampling schemes on a number of tasks. |
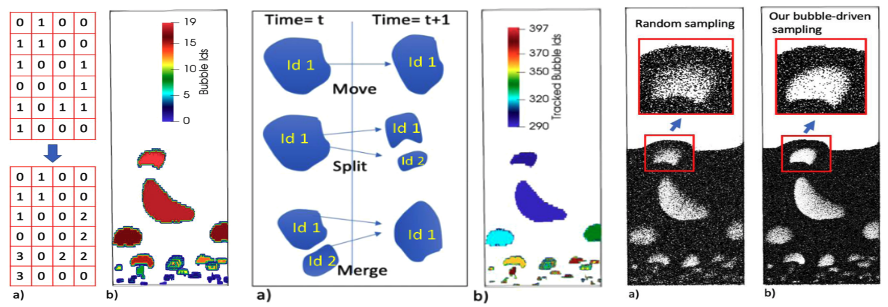 | [J9] Ayan Biswas, James Ahrens, Soumya Dutta, Jordan Musser, Ann Almgren, and Terece Turton, Feature Analysis, Tracking, and Data Reduction: An Application to Multiphase Reactor Simulation MFiX-Exa for In-Situ Use Case, IEEE Computing in Science & Engineering (IEEE CiSE), 2021, Volume 23, Issue 1, pp. 75-82. [Link] [Pdf] [BibTex] AbstractAs we enter the exascale computing regime, powerful supercomputers continue to produce much higher amounts of data than what can be stored for offline data processing. To utilize such high compute capabilities on these machines, much of the data processing needs to happen in situ, when the full high-resolution data is available at the supercomputer memory. In this article, we discuss our MFiX-Exa simulation, which models multiphase flow by tracking a very large number of particles through the simulation domain. In one of the use cases, the carbon particles interact with air to produce carbon dioxide bubbles from the reactor. These bubbles are of primary interest to the domain experts for these simulations. For this particle-based simulation, we propose a streaming technique that can be deployed in situ to efficiently identify the bubbles, track them over time, and use them to down-sample the data with minimal loss in these features. |
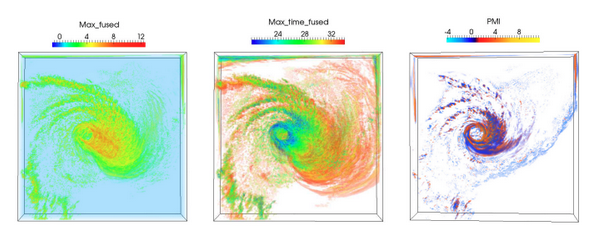
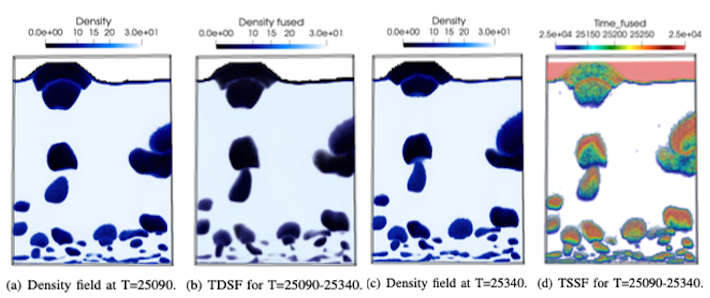 | [C12] Soumya Dutta, Humayra Tasnim, Terece L. Turton, and James Ahrens, In Situ Adaptive Spatio-Temporal Data Summarization, IEEE International Conference on Big Data (IEEE Bigdata), 2021, pp. 315-321. [Link] [Pdf] [BibTex] AbstractScientists nowadays use data sets generated from large-scale scientific computational simulations to understand the intricate details of various physical phenomena. These simulations produce large volumes of data at a rapid pace, containing thousands of time steps so that the spatio-temporal dynamics of the modeled phenomenon and its associated features can be captured with sufficient detail. Storing all the time steps into disks to perform traditional offline analysis will soon become prohibitive as the gap between the data generation speed and disk I/O speed continues to increase. In this work, we present an information-theoretic approach for in situ reduction of large-scale time-varying data sets via a combination of key and fused time steps. We show that this approach can greatly minimize the output data storage while preserving the temporal evolution of data. A detailed in situ application study is carried out to demonstrate the in situ viability of our technique for efficiently summarizing thousands of time steps generated from a large-scale real-life computational simulation code. |
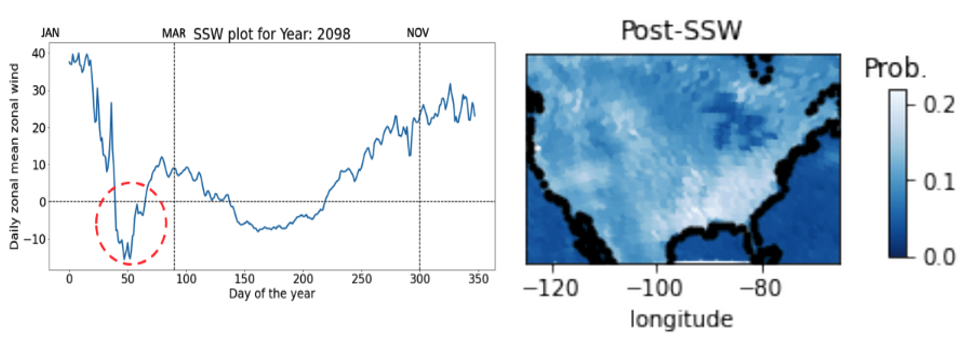 | [W5] Soumya Dutta, Natalie Klein, Li Tang, Jonathan Wolfe, Luke Van Roekel, James Benedict, Ayan Biswas, Earl Lawrence, and Nathan Urban, In Situ Climate Modeling for Analyzing Extreme Weather Events, In Situ Infrastructures for Enabling Extreme-scale Analysis and Visualization (ISAV 2021), pp. 18-23, co-located with SC 2021. [Link] [Pdf] [BibTex] [Best Paper Award] AbstractThe study of many extreme weather events requires simulations with high spatiotemporal data that can grow in size quickly. Storing all the raw data from such a large-scale simulation for traditional post hoc analyses is soon going to be prohibitive as the data generation speed is outpacing the data storage capability in supercomputers. In situ analysis has emerged as a solution to this problem; data is analyzed when it is being produced, bypassing the slower disk input/output (I/O). In this work, we develop an in situ analysis pathway for Energy Exascale Earth System Model (E3SM) and propose an algorithm for analyzing the impacts of sudden stratospheric warmings (SSWs), which can cause extreme cold temperature outbreaks at the surface, resulting in hazardous weather and disrupting many socioeconomic sectors. We detect SSWs and model the surface temperature data distributions in situ and show that post hoc analysis using the distribution models can predict the impact of SSWs in the continental United States. |
 | [Book Chap. 1] Roxana Bujack, Soumya Dutta, Duan Zhang, Tobias Gunther, Objective Finite-Time Flow Topology from Flowmap Expansion and Contraction, Topological Methods in Data Analysis and Visualization VI, Springer, 2021. [Link] [Pdf] [BibTex] AbstractWe extend the definition of the classic instantaneous vector field saddles, sinks, and sources to the finite-time setting by categorizing the domain based on the behavior of the flow map w.r.t. contraction or expansion. Since the intuitive Lagrangian approach turns out to be unusable in practice because it requires advection in unstable regions, we provide an alternative, sufficient criterion that can be computed in a robust way. We show that both definitions are objective, relate them to existing approaches, and show how the generalized critical points and their separatrices can be visualized. |
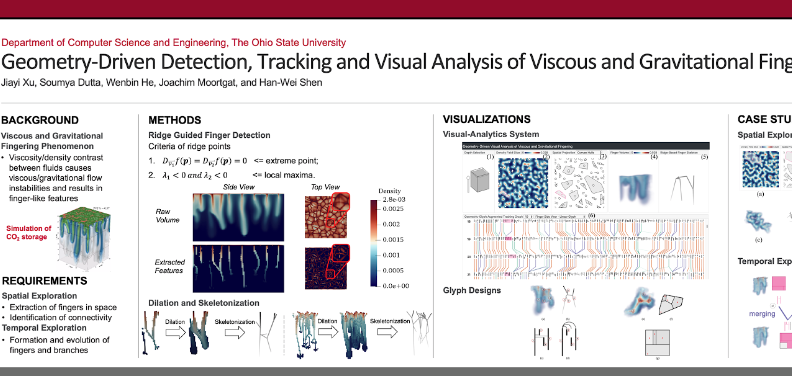 | [P3] Jiayi Xu, Soumya Dutta, Wenbin He, Joachim Moortgat, and Han-Wei Shen, Geometry-Driven Detection, Tracking and Visual Analysis of Viscous and Gravitational Fingers, 15th Annual CSE Student Research Poster Exhibition, The Ohio State University, 2021. |
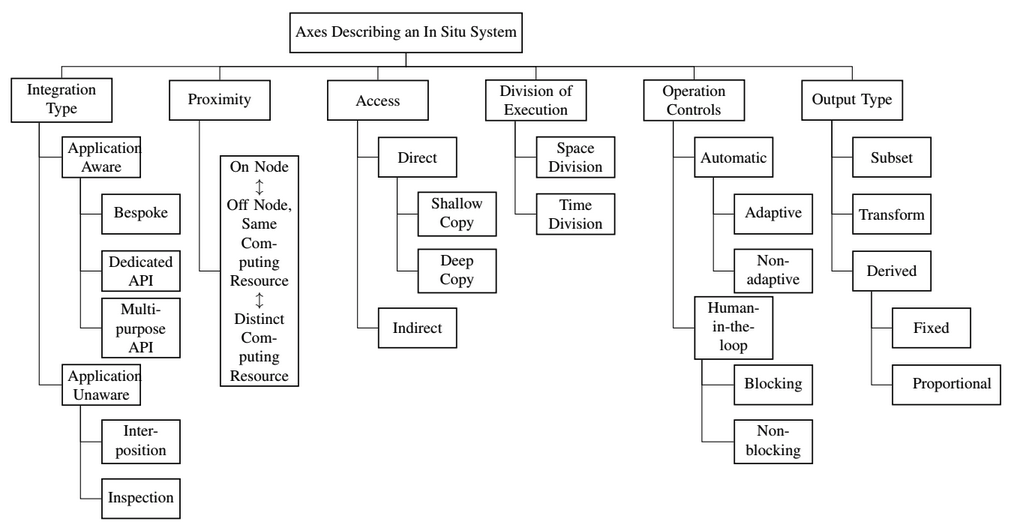 | [J8] Hank Childs, Sean D. Ahern, James Ahrens, Andrew C. Bauer, Janine Bennett, E. Wes Bethel, Peer-Timo Bremer, Eric Brugger, Joseph Cottam, Matthieu Dorier, Soumya Dutta, Jean M. Favre, Thomas Fogal, Steffen Frey, Christoph Garth, Berk Geveci, William F. Godoy, Charles D. Hansen, Cyrus Harrison, Bernd Hentschel, Joseph Insley, Chris R. Johnson, Scott Klasky, Aaron Knoll, James Kress, Matthew Larsen, Jay Lofstead, Kwan-Liu Ma, Preeti Malakar, Jeremy Meredith, Kenneth Moreland, Paul Navrátil, Patrick O’Leary, Manish Parashar, Valerio Pascucci, John Patchett, Tom Peterka, Steve Petruzza, Norbert Podhorszki, David Pugmire, Michel Rasquin, Silvio Rizzi, David H. Rogers, Sudhanshu Sane, Franz Sauer, Robert Sisneros, Han-Wei Shen, Will Usher, Rhonda Vickery, Venkatram Vishwanath, Ingo Wald, Ruonan Wang, Gunther H. Weber, Brad Whitlock, Matthew Wolf, Hongfeng Yu, Sean B. Ziegeler, A Terminology for In Situ Visualization and Analysis Systems, International Journal of High Performance Computing Applications (IJHPCA), 2020, Volume 34, Issue 6, pp. 676-691. [Link] [Pdf] [BibTex] AbstractThe term “in situ processing” has evolved over the last decade to mean both a specific strategy for visualizing and analyzing data and an umbrella term for a processing paradigm. The resulting confusion makes it difficult for visualization and analysis scientists to communicate with each other and with their stakeholders. To address this problem, a group of over fifty experts convened with the goal of standardizing terminology. This paper summarizes their findings and proposes a new terminology for describing in situ systems. An important finding from this group was that in situ systems are best described via multiple, distinct axes: integration type, proximity, access, division of execution, operation controls, and output type. This paper discusses these axes, evaluates existing systems within the axes, and explores how currently used terms relate to the axes. |
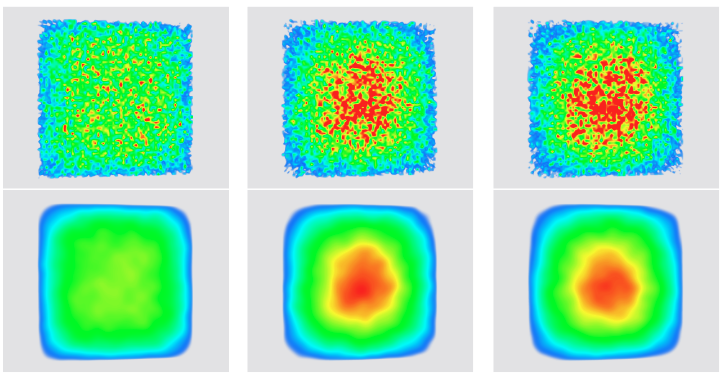
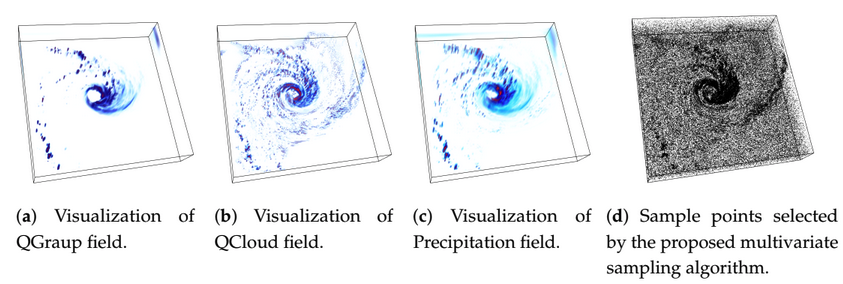 | [J7] Soumya Dutta, Ayan Biswas, and James Ahrens, Multivariate Pointwise Information-driven Data Sampling and Visualization, MDPI Entropy (Special issue in Information Theory Application in Visualization), 2019, Volume 21, Issue 7. [Link] [Pdf] [BibTex] AbstractWith increasing computing capabilities of modern supercomputers, the size of the data generated from the scientific simulations is growing rapidly. As a result, application scientists need effective data summarization techniques that can reduce large-scale multivariate spatiotemporal data sets while preserving the important data properties so that the reduced data can answer domain-specific queries involving multiple variables with sufficient accuracy. While analyzing complex scientific events, domain experts often analyze and visualize two or more variables together to obtain a better understanding of the characteristics of the data features. Therefore, data summarization techniques are required to analyze multi-variable relationships in detail and then perform data reduction such that the important features involving multiple variables are preserved in the reduced data. To achieve this, in this work, we propose a data sub-sampling algorithm for performing statistical data summarization that leverages pointwise information theoretic measures to quantify the statistical association of data points considering multiple variables and generates a sub-sampled data that preserves the statistical association among multi-variables. Using such reduced sampled data, we show that multivariate feature query and analysis can be done effectively. The efficacy of the proposed multivariate association driven sampling algorithm is presented by applying it on several scientific data sets. |
 | [J6] Subhashis Hazarika, Soumya Dutta, Han-Wei Shen, and Jen-Ping Chen, CoDDA: A Flexible Copula-based Distribution Driven Analysis Framework for Large-Scale Multivariate Data, IEEE Transactions on Visualization and Computer Graphics (TVCG), 2019, Volume 25, Issue 1, pp. 1214-1224. [Link] [Pdf] [BibTex] AbstractCoDDA (Copula-based Distribution Driven Analysis) is a flexible framework for large-scale multivariate datasets. A common strategy to deal with large-scale scientific simulation data is to partition the simulation domain and create statistical data summaries. Instead of storing the high-resolution raw data from the simulation, storing the compact statistical data summaries results in reduced storage overhead and alleviated I/O bottleneck. Such summaries, often represented in the form of statistical probability distributions, can serve various post-hoc analysis and visualization tasks. However, for multivariate simulation data using standard multivariate distributions for creating data summaries is not feasible. They are either storage inefficient or are computationally expensive to be estimated in simulation time (in situ) for large number of variables. In this work, using copula functions, we propose a flexible multivariate distribution-based data modeling and analysis framework that offers significant data reduction and can be used in an in situ environment. The framework also facilitates in storing the associated spatial information along with the multivariate distributions in an efficient representation. Using the proposed multivariate data summaries, we perform various multivariate post-hoc analyses like query-driven visualization and sampling-based visualization. We evaluate our proposed method on multiple real-world multivariate scientific datasets. To demonstrate the efficacy of our framework in an in situ environment, we apply it on a large-scale flow simulation. |
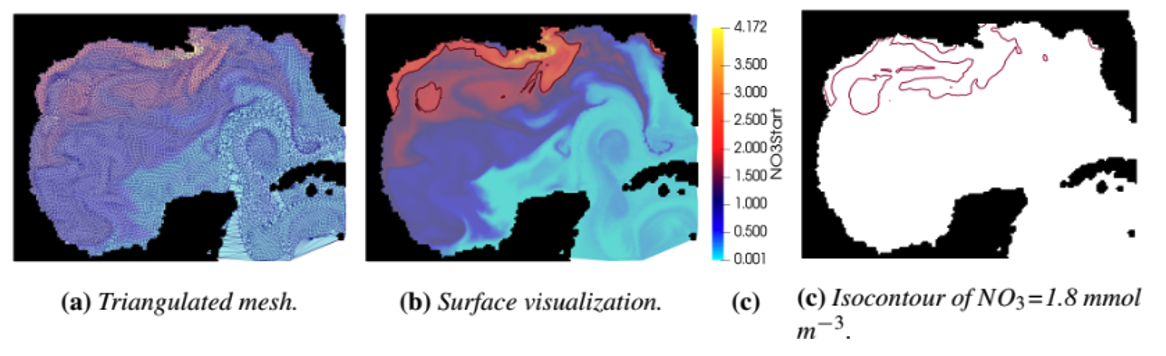 | [W4] Soumya Dutta, Riley X. Brady, Mathew E. Maltrud, Philip Wolfram, and Roxana Bujack, Leveraging Lagrangian Analysis for Discriminating Nutrient Origins, Visualization in Environmental Sciences (EnvirVis), 2019, pp. 17-24. [Link] [Pdf] [BibTex] AbstractUnderstanding the origins of nutrients, e.g., nitrate, in ocean water is essential to develop an effective mariculture technique for free-floating macroalgae, which presents a potential solution to provide an alternative source of domestic renewable fuels to help reduce carbon emissions from automobiles. To study this problem, scientists simulate large-scale computational simulations with coupled flow and nutrient information. Since running the simulation multiple times is expensive, the scientists want to have efficient visual-analytic techniques that can analyze and visualize the simulation output quickly to investigate the reasons behind the existence of nitrate in different areas of ocean water. To address these needs, a mixed Lagrangian and Eulerian-based analysis technique is developed that leverages traditional Lagrangian analysis methods and fuses Eulerian information with it to comprehend the origins of nutrients in the water. The proposed method yielded promising results for the application scientists and positive feedback from them demonstrates the efficacy of the technique. |
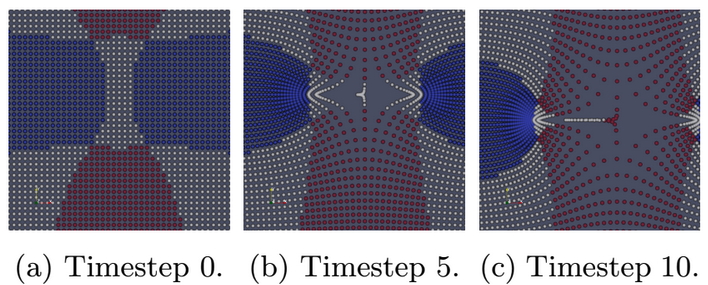 | [W3] Roxana Bujack, Soumya Dutta, Duan Zhang, Tobias Gunther, Objective Finite-Time Flow Topology from Flowmap Expansion and Contraction, Workshop on Topological Methods in Data Analysis and Visualization (TopoInVis), 2019. [Link] [Pdf] [BibTex] [Best Paper Award] AbstractWe extend the definition of the classic instantaneous vector field saddles, sinks, and sources to the finite-time setting by categorizing the domain based on the behavior of the flow map w.r.t. contraction or expansion. Since the intuitive Lagrangian approach turns out to be unusable in practice because it requires advection in unstable regions, we provide an alternative, sufficient criterion that can be computed in a robust way. We show that both definitions are objective, relate them to existing approaches, and show how the generalized critical points and their separatrices can be visualized. |
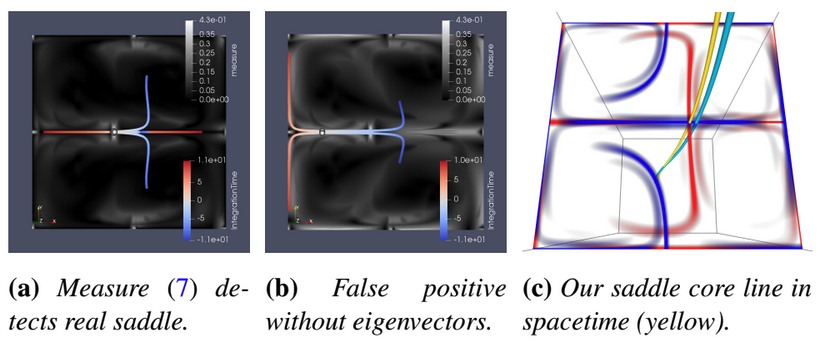 | [C11] Roxana Bujack, Soumya Dutta, Irene Baeza Rojo, Duan Zhang, Tobias Gunther, Objective Finite-Time Saddles and their Connection to FTLE, EG/VGTC Conference on Visualization (EuroVis Short Paper), 2019, pp. 49-53. [Link] [Pdf] [BibTex] AbstractBased on an intuitive physical definition of what a finite-time saddle-like behavior is, we derive a mathematical definition. We show that this definition builds the link between two FTLE-based saddle generalizations, which is not only of theoretical interest but also provides a more robust extraction of finite-time saddles. |
 | [J5] Subhashis Hazarika, Ayan Biswas, Soumya Dutta, and Han-Wei Shen, Information Guided Exploration of Scalar Values and Isocontours in Ensemble Datasets, MDPI Entropy (Special issue in Information Theory Application in Visualization), 2018, Volume 20, Issue 7. [Link] [Pdf] [BibTex] AbstractUncertainty of scalar values in an ensemble dataset is often represented by the collection of their corresponding isocontours. Various techniques such as contour-boxplot, contour variability plot, glyphs, and probabilistic marching-cubes assume that a scalar value of interest is already known to the user. Not much work has been done in guiding users to select the scalar values for such analysis. We propose a new information-theoretic approach by using specific information measures to evaluate the overall uncertainty associated with all the scalar values in an ensemble system. This helps the scientist to understand the effects of uncertainty on different data features. To understand in finer details the contribution of individual members towards the uncertainty of the ensemble isocontours of a selected scalar value, we propose a conditional entropy based algorithm to quantify the individual contributions. This can help simplify analysis and visualization for systems with more members by identifying the members contributing the most towards overall uncertainty. |
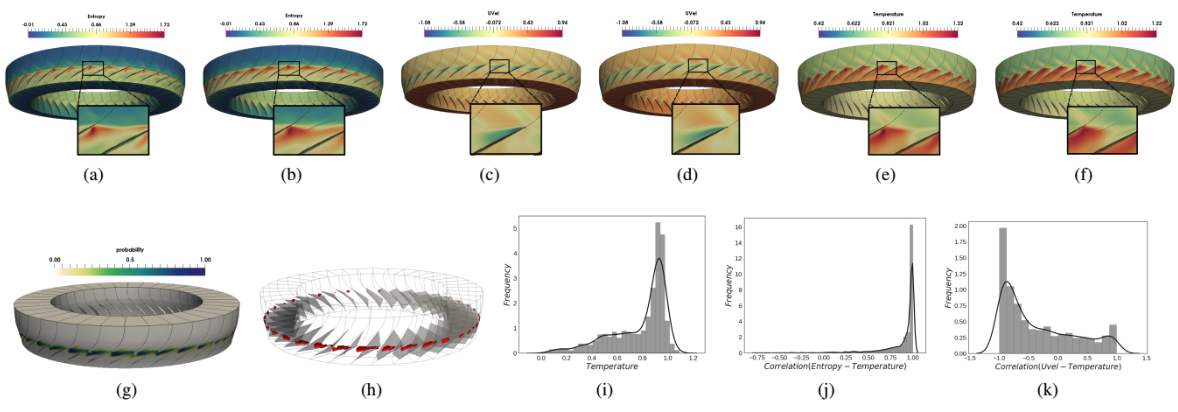
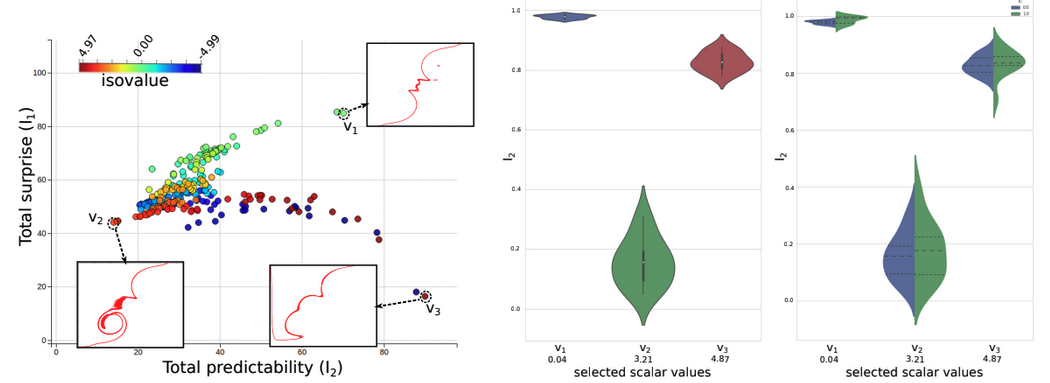
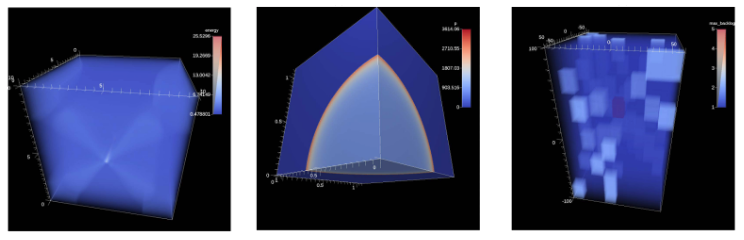
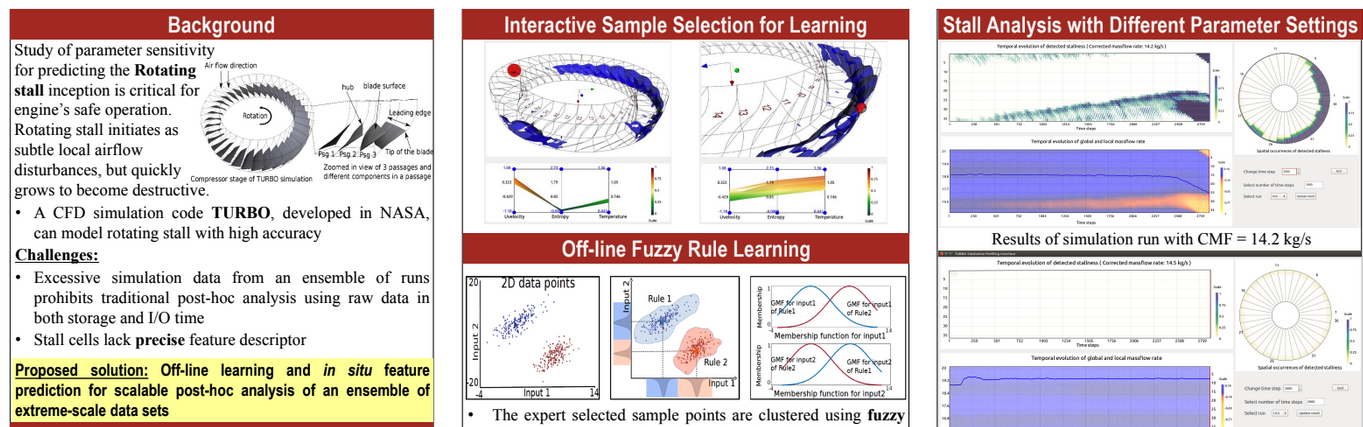
 | [C10] Soumya Dutta, Han-Wei Shen, and Jen-Ping Chen, In Situ Prediction Driven Feature Analysis in Jet Engine Simulations, IEEE Pacific Visualization Symposium (IEEE PacificVis), 2018, pp. 66-75. [Link] [Pdf] [BibTex] AbstractEfficient feature exploration in large-scale data sets using traditional post-hoc analysis approaches is becoming prohibitive due to the bottleneck stemming from I/O and output data sizes. This problem becomes more challenging when an ensemble of simulations are required to run for studying the influence of input parameters on the model output. As a result, scientists are inclining more towards analyzing the data in situ while it resides in the memory. In this work, we study the evolution of rotating stall in jet engines using data generated from a large-scale flow simulation under various input conditions. Since the features of interest lack a precise descriptor, we adopt a fuzzy rule based machine learning algorithm for efficient and robust extraction of such features. For scalable exploration, we advocate for an off-line learning and in situ prediction driven strategy that facilitates in-depth study of the stall. We verify and validate our method through comprehensive expert evaluation demonstrating the efficacy of our approach. |
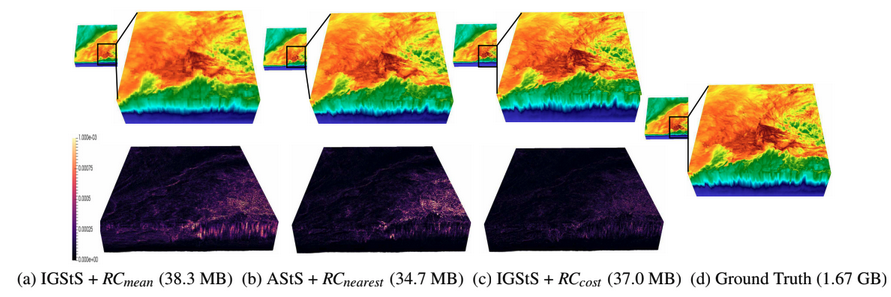 | [C9] Tzu-Hsuan Wei, Soumya Dutta, and Han-Wei Shen, Information Guided Data Sampling and Recovery using Bitmap Indexing, IEEE Pacific Visualization Symposium (IEEE PacificVis), 2018, pp. 56-65. [Link] [Pdf] [BibTex] AbstractCreating a data representation is a common approach for efficient and effective data management and exploration. The compressed bitmap indexing is one of the emerging data representation used for large-scale data exploration. Performing sampling on the bitmap-indexing based data representation allows further reduction of storage overhead and be more flexible to meet the requirements of different applications. In this paper, we propose two approaches to solve two potential limitations when exploring and visualizing the data using sampling-based bitmap indexing data representation. First, we propose an adaptive sampling approach called information guided stratified sampling (IGStS) for creating compact sampled datasets that preserves the important characteristics of the raw data. Furthermore, we propose a novel data recovery approach to reconstruct the irregular subsampled dataset into a volume dataset with regular grid structure for qualitative post-hoc data exploration and visualization. The quantitative and visual efficacy of our proposed data sampling and recovery approaches are demonstrated through multiple experiments and applications. |
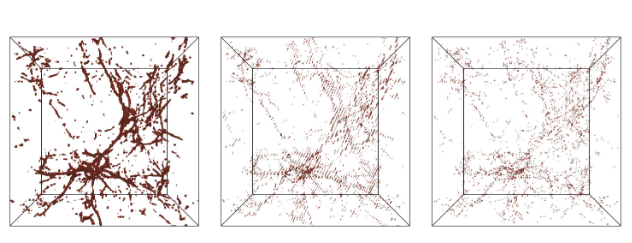 | [W2] Ayan Biswas, Soumya Dutta, Jesus Pulido, and James Ahrens, In Situ Data-Driven Adaptive Sampling for Large-scale Simulation Data Summarization, In Situ Infrastructures for Enabling Extreme-scale Analysis and Visualization (ISAV), pp. 13-18, co-located with SC 2018. [Link] [Pdf] [BibTex] AbstractRecent advancements in high-performance computing have enabled scientists to model various scientific phenomena in great detail. However, the analysis and visualization of the output data from such large-scale simulations are posing significant challenges due to their excessive size and disk I/O bottlenecks. In this work,we propose an information-driven data sampling technique and compare it with two well-known sampling methods to demonstrate the superiority of the proposed method. The in situ performance of the proposed method is evaluated by applying it to the Nyx Cosmology simulation. We compare and contrast the performance of these various sampling algorithms and provide a holistic view of all the methods so that the scientists can choose appropriate sampling schemes based on their analysis requirements. |
 | [W1] Matthew Larsen, Amy Woods, Nicole Marsaglia, Ayan Biswas, Soumya Dutta, Cyrus Harrison, and Hank Childs, A Flexible System For In Situ Triggers, In Situ Infrastructures for Enabling Extreme-scale Analysis and Visualization (ISAV 2018), pp. 1-6, co-located with SC 2018. [Link] [Pdf] [BibTex] [Best Paper Award] AbstractTriggers are an important mechanism for adapting visualization, analysis, and storage actions. With this work, we describe the Ascent in situ infrastructure’s system for triggers. This system splits triggers into two components: when to per- form an action and what actions to perform. The decision for when to perform an action can be based on different types of factors, such as mesh topology, scalar fields, or performance data. The actions to perform are also varied, ranging from the traditional action of saving simulation state to disk to performing arbitrary visualizations and analyses. We also include details on the implementation and short examples demonstrating how the system can be used. |
 | [P2] Soumya Dutta, Han-Wei Shen, and Jen-Ping Chen, In Situ Prediction Driven Feature Analysis in Jet Engine Simulations, 12th Annual CSE Student Research Poster Exhibition, The Ohio State University, 2018. [Best Poster Award] |
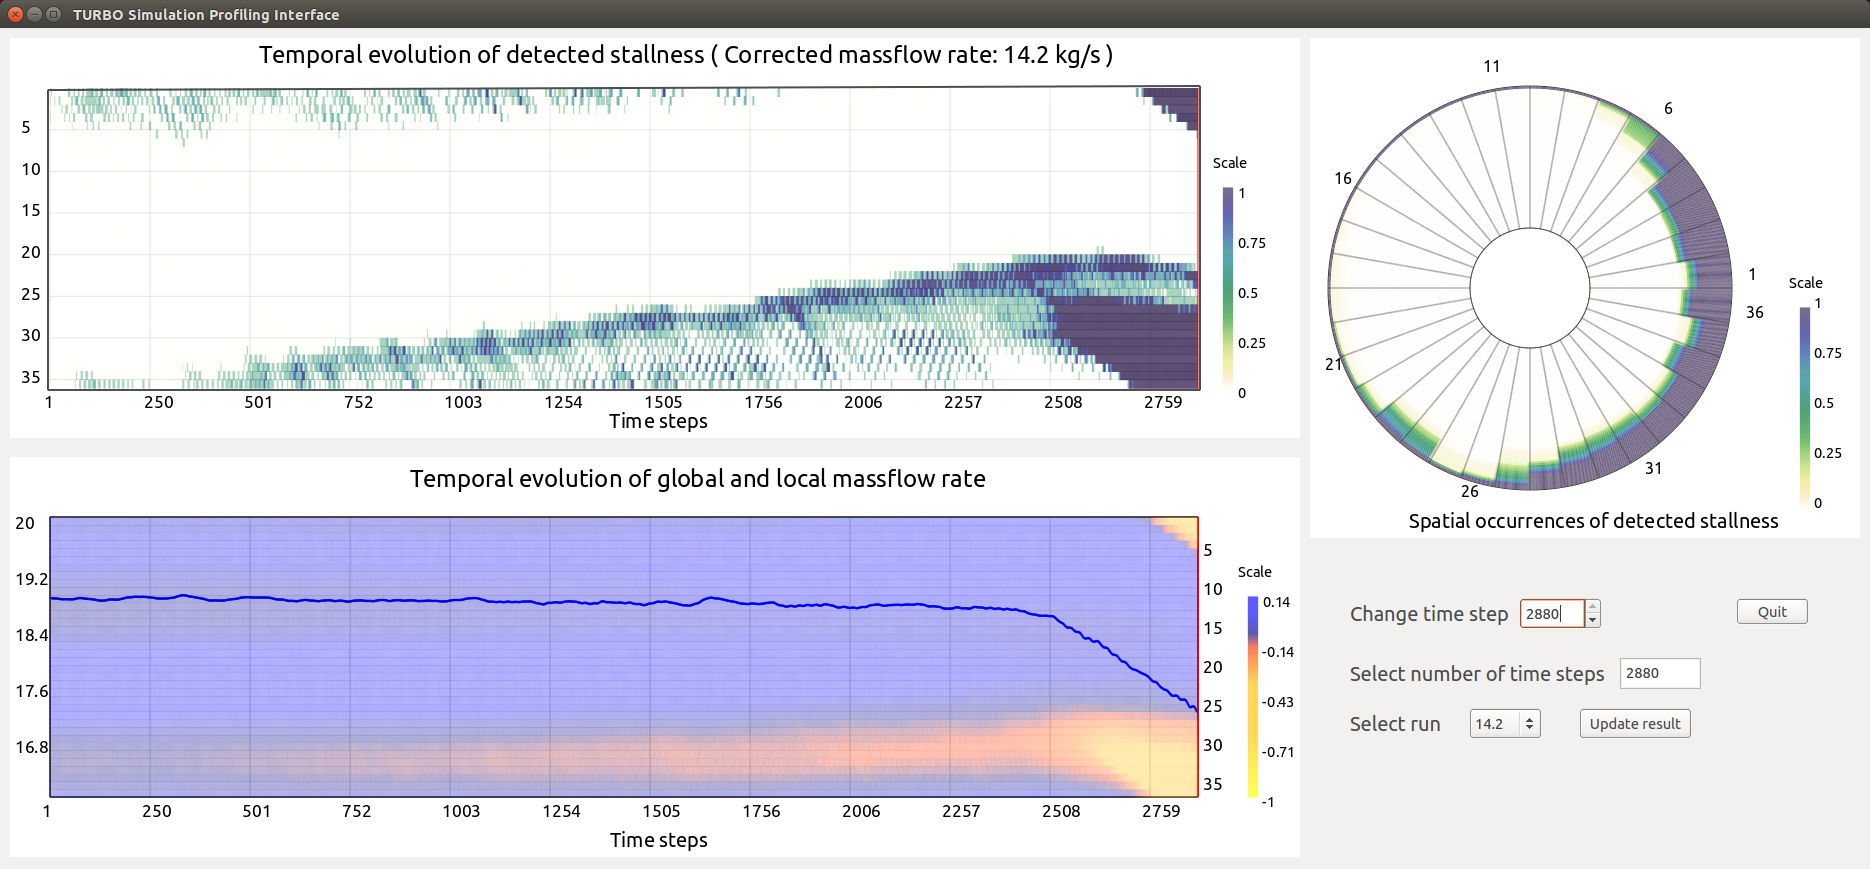
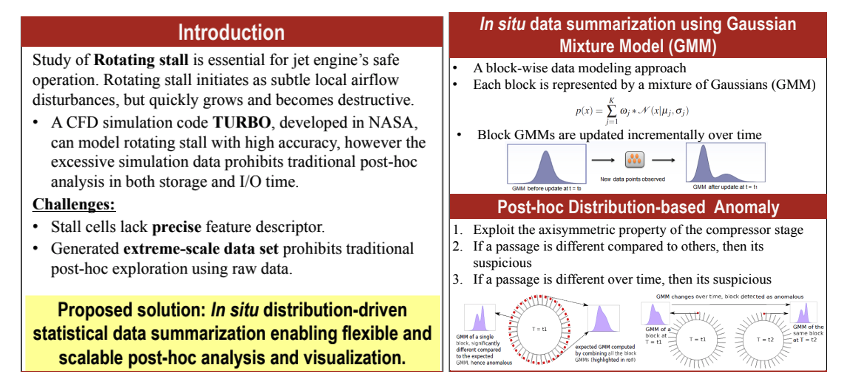
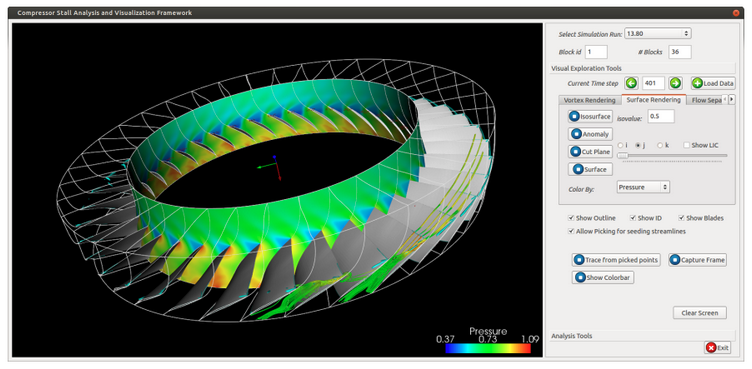
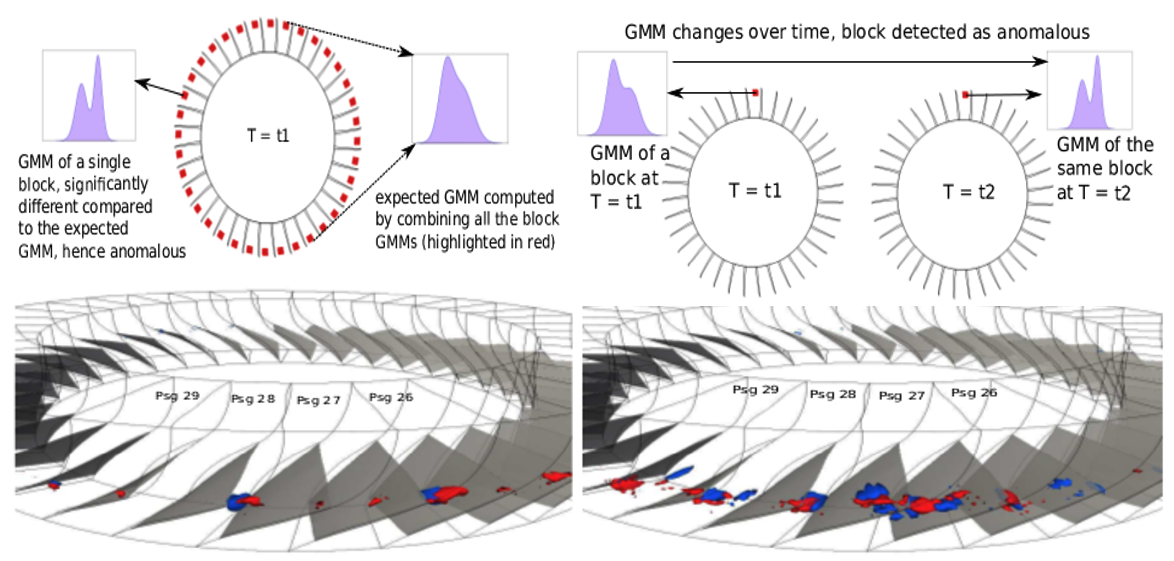 | [J4] Soumya Dutta, Chun-Ming Chen, Gregory Heinlein, Han-Wei Shen, and Jen-Ping Chen, In Situ Distribution Guided Analysis and Visualization of Transonic Jet Engine Simulations, IEEE Transactions on Visualization and Computer Graphics (TVCG), 2017, Volume 23, Issue 1, pp. 811-820. [Link] [Pdf] [BibTex] [Best Paper Honorable Mention Award] AbstractStudy of flow instability in turbine engine compressors is crucial to understand the inception and evolution of engine stall. A state-of-the-art Navier-Stokes based, time-accurate computational fluid dynamics simulator, TURBO, has been developed in NASA to enhance the understanding of flow phenomena undergoing rotating stall. Despite the proven high modeling accuracy of TURBO, the excessive simulation data prohibits post-hoc analysis in both storage and I/O time. To address these issues and allow the expert to perform scalable stall analysis, we have designed an in situ distribution guided stall analysis technique. Our method summarizes statistics of important properties of the simulation data in situ using a probabilistic data modeling scheme. This data summarization enables statistical anomaly detection for flow instability in post analysis, which reveals the spatio-temporal trends of rotating stall for the expert to conceive new hypotheses. |
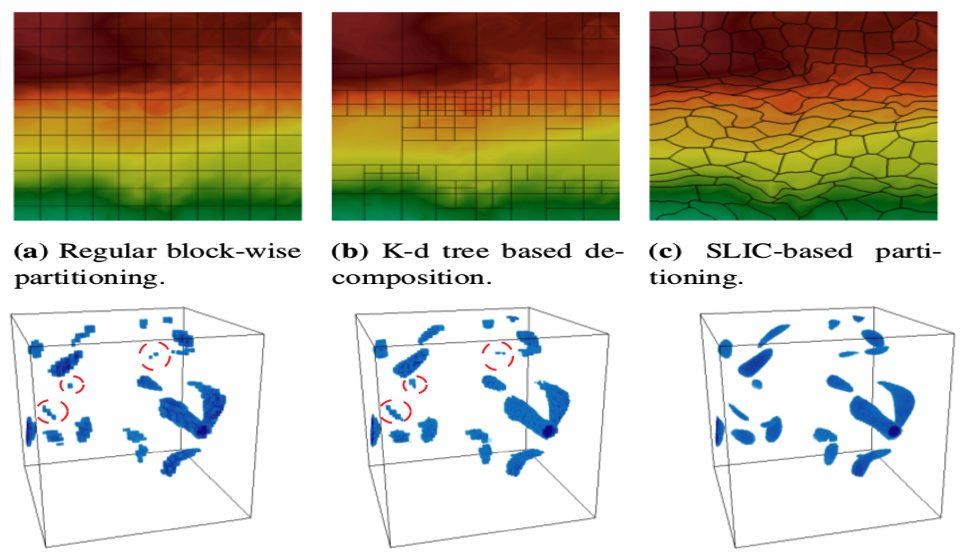 | [C8] Soumya Dutta, Jonathan Woodring, Han-Wei Shen, Jen-Ping Chen, and James Ahrens, Homogeneity Guided Probabilistic Data Summaries for Analysis and Visualization of Large-Scale Data Sets, IEEE Pacific Visualization Symposium (IEEE PacificVis), 2017, 111-120. [Link] [Pdf] [BibTex] AbstractHigh-resolution simulation data sets provide plethora of information, which needs to be explored by application scientists to gain enhanced understanding about various phenomena. Visual-analytics techniques using raw data sets are often expensive due to the data sets' extreme sizes. But, interactive analysis and visualization is crucial for big data analytics, because scientists can then focus on the important data and make critical decisions quickly. To assist efficient exploration and visualization, we propose a new region-based statistical data summarization scheme. Our method is superior in quality, as compared to the existing statistical summarization techniques, with a more compact representation, reducing the overall storage cost. The quantitative and visual efficacy of our proposed method is demonstrated using several data sets along with an in situ application study for an extreme-scale flow simulation. |
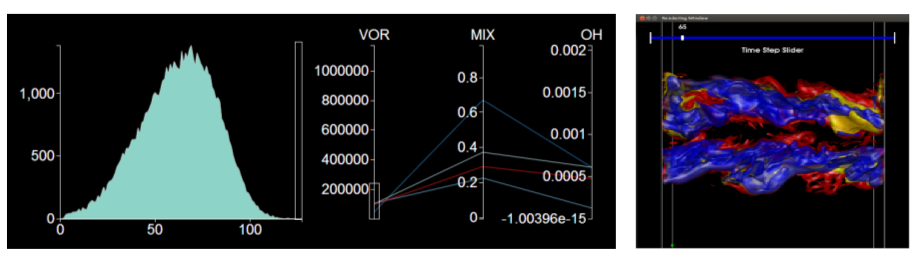
 | [C7] Soumya Dutta, Xiaotong Liu, Ayan Biswas, Han-Wei Shen, and Jen-Ping Chen, Pointwise Information Guided Visual Analysis of Time-varying Multi-fields, SA'17, SIGGRAPH Asia Symposium on Visualization, 2017. [Link] [Pdf] [BibTex] AbstractIdentification of salient features from a time-varying multivariate system plays an important role in scientific data understanding. In this work, we present a unified analysis framework based on mutual information and two of its decomposition to quantify the amount of information content between different value combinations from multiple variables over time. The pointwise mutual information (PMI), computed for each value combination, is used to construct informative scalar fields, which allow close examination of combined and complementary information possessed by multiple variables. Since PMI gives us a way of quantifying information shared among all combinations of scalar values for multiple variables, it is used to identify salient isovalue tuples. Simultaneous visualization of isosurfaces on those selected tuples depicts combined or complementary relationships in the data. For intuitive interaction with the data, an interactive interface is designed based on the proposed information-theoretic measures. Finally, successful application of the proposed method on two time-varying data sets demonstrates the efficacy of the system. |
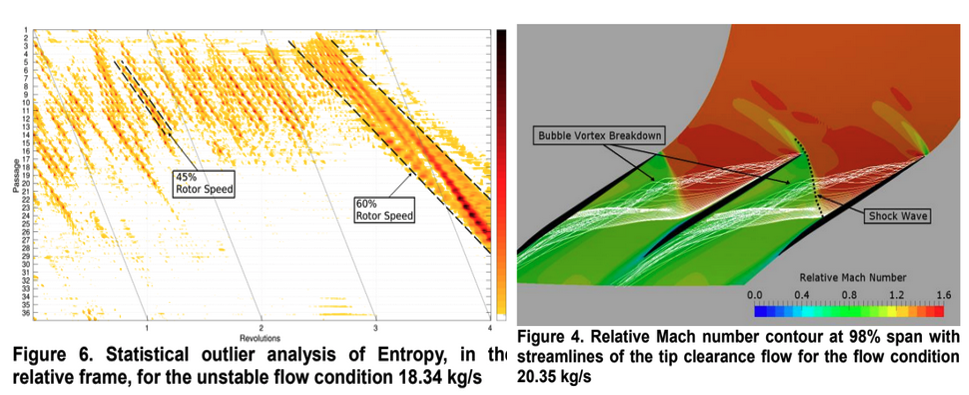 | [C6] Gregory Heinlein, Jen-Ping Chen, Chun-Ming Chen, Soumya Dutta, and Han-Wei Shen, Statistical Anomaly Based Study of Rotating Stall in a Transonic Axial Compressor Stage, Turbomachinery Technical Conference & Exposition (ASME Turbo Expo, GT 2017). [Link] [Pdf] [BibTex] AbstractTip clearance flow in transonic rotors is known to have a significant effect on compressor performance and stability. The purpose of this study is to employ a novel statistical analysis method as a stall precursor detector and investigate the flow physics underlying stall inception. To allow for natural stall evolution, a full annulus simulation of a transonic axial compressor stage (NASA Stage 35) was performed. Due to the size of the data set, a novel statistical analysis method was employed to rapidly analyze the entire spatial and temporal simulation domain. The analysis method involved utilizing a Grubb’s test pointwise on the domain’s grid for Entropy to reveal regions, times, and trends that are statistically anomalous and could be of interest for future evaluation. Through use of the anomaly detecting Grubb’s test rotating stall, which developed in the stage, could be tracked back in time to immediately after the computed mass flow stabilization of a particular operating condition. It was determined that an 18th order modal behavior dominated the pre-stall regime of NASA stage 35 operating in a near stall condition. The modal behavior was a result of a spiral-type vortex breakdown of the tip clearance vortex after interacting with the passage shock. A rotating disturbance region, moving faster than the rotor speed, amplified an instability within the spiral-type vortex breakdown. The growth of the instability caused the amplitude of the spiral-type vortex breakdown to increase in the radial and circumferential directions. Eventually, the disturbance region broke down into rotating stall due to decreased mass flow rate and high loading. The statistical Grubbs’ test of Entropy showed the efficacy of the method at detecting the earliest signs of rotating stall. |
 | [P1] Soumya Dutta, Chun-Ming Chen, Gregory Heinlein, Han-Wei Shen, and Jen-Ping Chen, In Situ Distribution Guided Analysis and Visualization of Transonic Jet Engine Simulations, 11th Annual CSE Student Research Poster Exhibition, The Ohio State University, 2017. [Best Poster Award] |
| | [J3] Soumya Dutta and Han-Wei Shen, Distribution Driven Extraction and Tracking of Features for Time-varying Data Analysis, IEEE Transactions on Visualization and Computer Graphics (TVCG), 2016, Volume 22, Issue 1, pp. 837-846. [Link] [Pdf] [BibTex] AbstractEffective analysis of features in time-varying data is essential in numerous scientific applications. Feature extraction and tracking are two important tasks scientists rely upon to get insights about the dynamic nature of the large scale time-varying data. However, often the complexity of the scientific phenomena only allows scientists to vaguely define their feature of interest. Furthermore, such features can have varying motion patterns and dynamic evolution over time. In this work, we investigate these issues and propose a distribution driven approach which allows us to construct novel algorithms for reliable feature extraction and tracking with high confidence. We exploit two key properties of an object, motion and similarity to the target feature, and fuse the information gained from them to generate a robust feature-aware classification field at every time step. Tracking of features is done using such classified fields which enhances the accuracy and robustness of the proposed algorithm. |
 | [J2] Chun-Ming Chen, Soumya Dutta, Xiaotong Liu, Gregory Heinlein, Han-Wei Shen, and Jen-Ping Chen, Visualization and Analysis of Rotating Stall for Transonic Jet Engine Simulation, IEEE Transactions on Visualization and Computer Graphics (TVCG), 2016, Volume 22, Issue 1, pp. 847-856. [Link] [Pdf] [BibTex] AbstractIdentification of early signs of rotating stall is essential for the study of turbine engine stability. With recent advancements of high performance computing, high-resolution unsteady flow fields allow in depth exploration of rotating stall and its possible causes. Performing stall analysis, however, involves significant effort to process large amounts of simulation data, especially when investigating abnormalities across many time steps. In order to assist scientists during the exploration process, we present a visual analytics framework to identify suspected spatiotemporal regions through a comparative visualization so that scientists are able to focus on relevant data in more detail. To achieve this, we propose efficient stall analysis algorithms derived from domain knowledge and convey the analysis results through juxtaposed interactive plots. Using our integrated visualization system, scientists can visually investigate the detected regions for potential stall initiation and further explore these regions to enhance the understanding of this phenomenon. Positive feedback from scientists demonstrate the efficacy of our system in analyzing rotating stall. |
 | [C5] Subhashis Hazarika, Soumya Dutta, Han-Wei Shen, Visualizing the Variations of Ensemble of Isosurfaces, IEEE Pacific Visualization Symposium (IEEE PacificVis Notes), 2016, 209-213. [Link] [Pdf] [BibTex] AbstractVisualizing the similarities and differences among an ensemble of isosurfaces is a challenging problem mainly because the isosurfaces cannot be displayed together at the same time. For ensemble of isosurfaces, visualizing these spatial differences among the surfaces is essential to get useful insights as to how the individual ensemble simulations affect different isosurfaces. We propose a scheme to visualize the spatial variations of isosurfaces with respect to statistically significant isosurfaces within the ensemble. Understanding such variations among ensemble of isosurfaces at different spatial regions is helpful in analyzing the influence of different ensemble runs over the spatial domain. In this regard, we propose an isosurface-entropy based clustering scheme to divide the spatial domain into regions of high and low isosurface variation. We demonstrate the efficacy of our method by successfully applying it on real-world ensemble data sets from ocean simulation experiments and weather forecasts. |
 | [TR2] Garrett A. Aldrich, Soumya Dutta, and Jonathan Woodring, OpenMC In Situ Source Convergence Detection, Los Alamos National Laboratory (LA-UR-16-23217), 2016. |
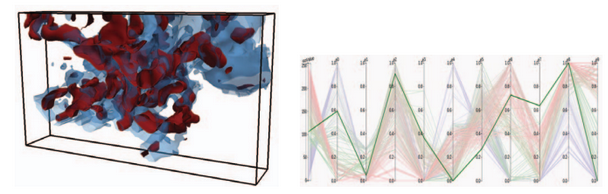
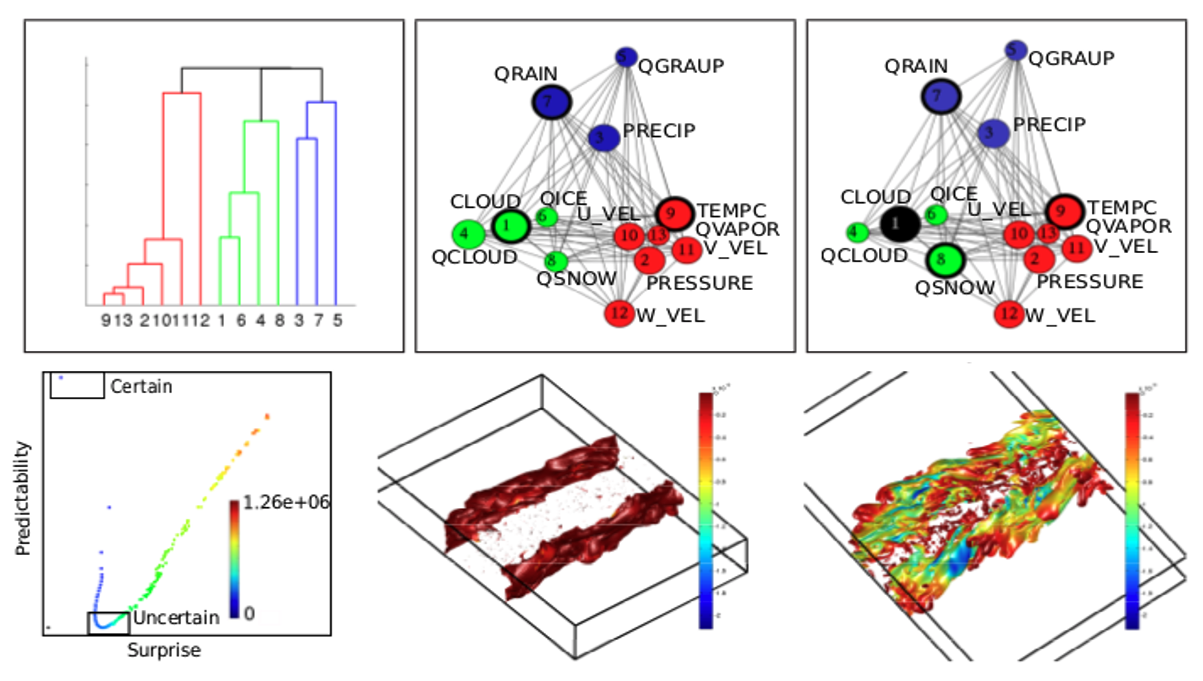 | [J1] Ayan Biswas, Soumya Dutta, Han-Wei Shen, and Jonathan Woodring, An Information-Aware Framework for Exploring Multivariate Data Sets, IEEE Transactions on Visualization and Computer Graphics (TVCG), 2013, Volume 19, Issue 12, pp. 2683-2692. [Link] [Pdf] [BibTex] AbstractInformation theory provides a theoretical framework for measuring information content for an observed variable, and has attracted much attention from visualization researchers for its ability to quantify saliency and similarity among variables. In this paper, we present a new approach towards building an exploration framework based on information theory to guide the users through the multivariate data exploration process. In our framework, we compute the total entropy of the multivariate data set and identify the contribution of individual variables to the total entropy. The variables are classified into groups based on a novel graph model. The variables inside the groups are analyzed for their representativeness and an information based importance is assigned. We exploit specific information metrics to analyze the relationship between the variables and use the metrics to choose isocontours of selected variables. Experiments with different data sets reveal the effectiveness of our proposed framework in depicting the interesting regions of the data sets taking into account the interaction among the variables. |
 | [TR1] Soumya Dutta, Xiaotong Liu, Ayan Biswas, Han-Wei Shen, Yifan Hu, James Giuliani, and Jen-Ping Chen, Pointwise Information Analysis for Multivariate Time-varying Feature Identification, OSU-CISRC-6/14-TR13, 2013. |
| [C4] Soumya Dutta and Madhurima Chattopadhyay, A change detection algorithm for medical cell images, International Conference on Scientific Paradigm Shift in Information Technology and Management (SPSITM 2011), 2011, 524-527. [Link] [BibTex] |
| [C3] Soumya Dutta and Bidyut B. Chaudhuri, A Color Edge Detection Algorithm in RGB Color Space, Advances in Recent Technologies in Communication and Computing (ARTCOM 2009), 2009, 337-340. [Link] [BibTex] |
| [C2] Soumya Dutta and Bidyut B. Chaudhuri, Homogeneous region based color image segmentation, The World Congress on Engineering and Computer Science (WCECS 2009), 2009, vol 2, 1301-1305. [Link] [BibTex] |
| [C1] Soumya Dutta and Bidyut B. Chaudhuri, A Statistics and Local Homogeneity Based Color Edge Detection Algorithm, Advances in Recent Technologies in Communication and Computing (ARTCOM 2009), 2009, 546-548. [Link] [BibTex] |